
|
Nova Lifestyle, Inc. (NVFY) Avaliação DCF |
Totalmente Editável: Adapte-Se Às Suas Necessidades No Excel Ou Planilhas
Design Profissional: Modelos Confiáveis E Padrão Da Indústria
Pré-Construídos Para Uso Rápido E Eficiente
Compatível com MAC/PC, totalmente desbloqueado
Não É Necessária Experiência; Fácil De Seguir
Nova LifeStyle, Inc. (NVFY) Bundle
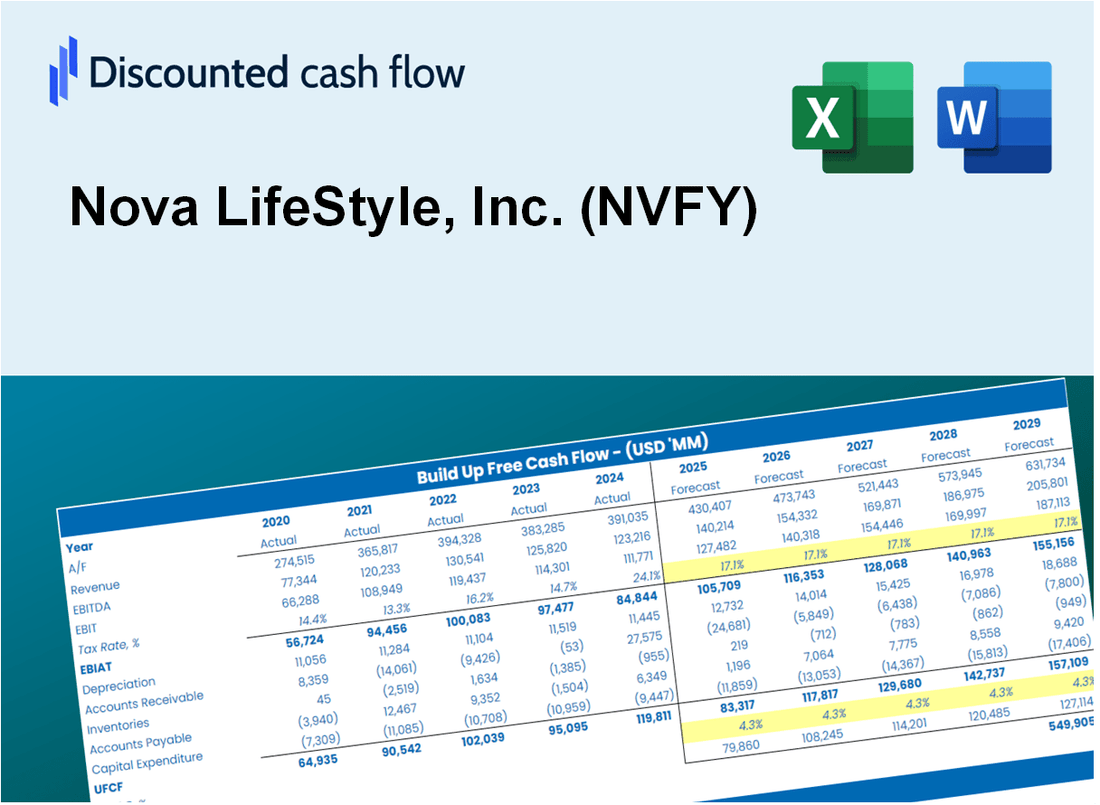
Simplifique a avaliação da Nova Lifestyle, Inc. (NVFY) com esta calculadora DCF personalizável! Apresentando o Real Lifestyle, Inc. (NVFY) financeiras e insumos de previsão ajustáveis, você pode testar cenários e descobrir o valor justo da Nova Lifestyle, Inc. (NVFY) em minutos.
Discounted Cash Flow (DCF) - (USD MM)
| Year | AY1 2020 |
AY2 2021 |
AY3 2022 |
AY4 2023 |
AY5 2024 |
FY1 2025 |
FY2 2026 |
FY3 2027 |
FY4 2028 |
FY5 2029 |
|---|---|---|---|---|---|---|---|---|---|---|
| Revenue | 11.4 | 12.8 | 12.7 | 11.1 | 9.7 | 9.4 | 9.1 | 8.8 | 8.5 | 8.2 |
| Revenue Growth, % | 0 | 12.89 | -0.53345 | -13 | -12.63 | -3.32 | -3.32 | -3.32 | -3.32 | -3.32 |
| EBITDA | -25.6 | -3.0 | -15.7 | -5.6 | -4.8 | -6.1 | -5.9 | -5.7 | -5.5 | -5.3 |
| EBITDA, % | -225.17 | -23.52 | -122.8 | -50.64 | -49.92 | -64.82 | -64.82 | -64.82 | -64.82 | -64.82 |
| Depreciation | .7 | .8 | .6 | .8 | .5 | .6 | .5 | .5 | .5 | .5 |
| Depreciation, % | 6.59 | 6.61 | 4.49 | 7.25 | 5.27 | 6.04 | 6.04 | 6.04 | 6.04 | 6.04 |
| EBIT | -26.3 | -3.9 | -16.2 | -6.4 | -5.3 | -6.4 | -6.2 | -6.0 | -5.8 | -5.6 |
| EBIT, % | -231.76 | -30.13 | -127.29 | -57.89 | -55.18 | -68.64 | -68.64 | -68.64 | -68.64 | -68.64 |
| Total Cash | 8.7 | 6.3 | 1.4 | .4 | .2 | 2.7 | 2.6 | 2.5 | 2.4 | 2.3 |
| Total Cash, percent | .0 | .0 | .0 | .0 | .0 | .0 | .0 | .0 | .0 | .0 |
| Account Receivables | 1.1 | .4 | .4 | .1 | .1 | .3 | .3 | .3 | .3 | .3 |
| Account Receivables, % | 10.01 | 3.14 | 2.88 | 0.79606 | 0.55524 | 3.48 | 3.48 | 3.48 | 3.48 | 3.48 |
| Inventories | 32.8 | 17.7 | 4.9 | 2.3 | 7.5 | 6.3 | 6.1 | 5.9 | 5.7 | 5.5 |
| Inventories, % | 289.11 | 137.8 | 38.7 | 20.81 | 77.56 | 67.41 | 67.41 | 67.41 | 67.41 | 67.41 |
| Accounts Payable | .7 | .4 | .3 | .4 | .7 | .4 | .4 | .4 | .4 | .4 |
| Accounts Payable, % | 6.55 | 2.8 | 2.52 | 3.88 | 7.52 | 4.65 | 4.65 | 4.65 | 4.65 | 4.65 |
| Capital Expenditure | -.4 | -.2 | .0 | .0 | .0 | -.1 | -.1 | -.1 | -.1 | -.1 |
| Capital Expenditure, % | -3.22 | -1.21 | -0.06882769 | 0 | -0.14577 | -0.92781 | -0.92781 | -0.92781 | -0.92781 | -0.92781 |
| Tax Rate, % | -0.04702208 | -0.04702208 | -0.04702208 | -0.04702208 | -0.04702208 | -0.04702208 | -0.04702208 | -0.04702208 | -0.04702208 | -0.04702208 |
| EBITAT | -25.7 | -3.9 | -16.2 | -7.1 | -5.3 | -6.4 | -6.2 | -6.0 | -5.8 | -5.6 |
| Depreciation | ||||||||||
| Changes in Account Receivables | ||||||||||
| Changes in Inventories | ||||||||||
| Changes in Accounts Payable | ||||||||||
| Capital Expenditure | ||||||||||
| UFCF | -58.5 | 12.3 | -2.9 | -3.3 | -9.7 | -5.3 | -5.5 | -5.3 | -5.2 | -5.0 |
| WACC, % | 9.73 | 9.75 | 9.75 | 9.75 | 9.75 | 9.75 | 9.75 | 9.75 | 9.75 | 9.75 |
| PV UFCF | ||||||||||
| SUM PV UFCF | -20.1 | |||||||||
| Long Term Growth Rate, % | 2.00 | |||||||||
| Free cash flow (T + 1) | -5 | |||||||||
| Terminal Value | -66 | |||||||||
| Present Terminal Value | -41 | |||||||||
| Enterprise Value | -61 | |||||||||
| Net Debt | 2 | |||||||||
| Equity Value | -63 | |||||||||
| Diluted Shares Outstanding, MM | 3 | |||||||||
| Equity Value Per Share | -18.36 |
What You Will Get
- Real Nova LifeStyle Data: Preloaded financials – from revenue to EBIT – based on actual and projected figures for Nova LifeStyle, Inc. (NVFY).
- Full Customization: Adjust all critical parameters (yellow cells) like WACC, growth %, and tax rates to fit your analysis needs.
- Instant Valuation Updates: Automatic recalculations to analyze the impact of changes on Nova LifeStyle’s fair value.
- Versatile Excel Template: Designed for quick edits, scenario testing, and detailed projections specific to Nova LifeStyle, Inc. (NVFY).
- Time-Saving and Accurate: Eliminate the hassle of building models from scratch while ensuring precision and flexibility in your evaluations.
Key Features
- Comprehensive DCF Calculator: Provides detailed unlevered and levered DCF valuation models tailored for Nova LifeStyle, Inc. (NVFY).
- WACC Calculator: Features a pre-built Weighted Average Cost of Capital sheet with adjustable inputs.
- Customizable Forecast Assumptions: Adjust growth rates, capital expenditures, and discount rates as needed.
- Integrated Financial Ratios: Evaluate profitability, leverage, and efficiency ratios specifically for Nova LifeStyle, Inc. (NVFY).
- Interactive Dashboard and Charts: Visual representations summarize essential valuation metrics for straightforward analysis.
How It Works
- Download the Template: Gain immediate access to the Excel-based NVFY DCF Calculator.
- Input Your Assumptions: Modify the yellow-highlighted cells for growth rates, WACC, margins, and additional parameters.
- Instant Calculations: The model automatically recalculates Nova LifeStyle’s intrinsic value.
- Test Scenarios: Experiment with various assumptions to assess potential changes in valuation.
- Analyze and Decide: Utilize the results to inform your investment or financial analysis.
Why Choose Nova LifeStyle, Inc. (NVFY)?
- Innovative Solutions: Cutting-edge designs that enhance modern living spaces.
- Quality Assurance: High standards in manufacturing ensure durability and reliability.
- Eco-Friendly Options: Committed to sustainability with environmentally conscious products.
- Customer-Centric Approach: Tailored services and support to meet diverse client needs.
- Industry Recognition: Trusted by consumers and professionals for excellence in furniture design.
Who Should Use This Product?
- Professional Investors: Develop comprehensive and reliable valuation models for portfolio assessment of Nova LifeStyle, Inc. (NVFY).
- Corporate Finance Teams: Evaluate valuation scenarios to inform internal strategies for Nova LifeStyle, Inc. (NVFY).
- Consultants and Advisors: Deliver precise valuation insights to clients regarding Nova LifeStyle, Inc. (NVFY).
- Students and Educators: Utilize real-world data to practice and teach financial modeling with Nova LifeStyle, Inc. (NVFY).
- Home Furnishing Enthusiasts: Gain insights into how companies like Nova LifeStyle, Inc. (NVFY) are valued within the market.
What the Template Contains
- Pre-Filled DCF Model: Nova LifeStyle, Inc.’s (NVFY) financial data preloaded for immediate use.
- WACC Calculator: Detailed calculations for Weighted Average Cost of Capital.
- Financial Ratios: Evaluate Nova LifeStyle, Inc.’s (NVFY) profitability, leverage, and efficiency.
- Editable Inputs: Change assumptions such as growth, margins, and CAPEX to fit your scenarios.
- Financial Statements: Annual and quarterly reports to support detailed analysis.
- Interactive Dashboard: Easily visualize key valuation metrics and results.
Disclaimer
All information, articles, and product details provided on this website are for general informational and educational purposes only. We do not claim any ownership over, nor do we intend to infringe upon, any trademarks, copyrights, logos, brand names, or other intellectual property mentioned or depicted on this site. Such intellectual property remains the property of its respective owners, and any references here are made solely for identification or informational purposes, without implying any affiliation, endorsement, or partnership.
We make no representations or warranties, express or implied, regarding the accuracy, completeness, or suitability of any content or products presented. Nothing on this website should be construed as legal, tax, investment, financial, medical, or other professional advice. In addition, no part of this site—including articles or product references—constitutes a solicitation, recommendation, endorsement, advertisement, or offer to buy or sell any securities, franchises, or other financial instruments, particularly in jurisdictions where such activity would be unlawful.
All content is of a general nature and may not address the specific circumstances of any individual or entity. It is not a substitute for professional advice or services. Any actions you take based on the information provided here are strictly at your own risk. You accept full responsibility for any decisions or outcomes arising from your use of this website and agree to release us from any liability in connection with your use of, or reliance upon, the content or products found herein.