
|
Nexgen Energy Ltd. (NXE) Avaliação DCF |
Totalmente Editável: Adapte-Se Às Suas Necessidades No Excel Ou Planilhas
Design Profissional: Modelos Confiáveis E Padrão Da Indústria
Pré-Construídos Para Uso Rápido E Eficiente
Compatível com MAC/PC, totalmente desbloqueado
Não É Necessária Experiência; Fácil De Seguir
NexGen Energy Ltd. (NXE) Bundle
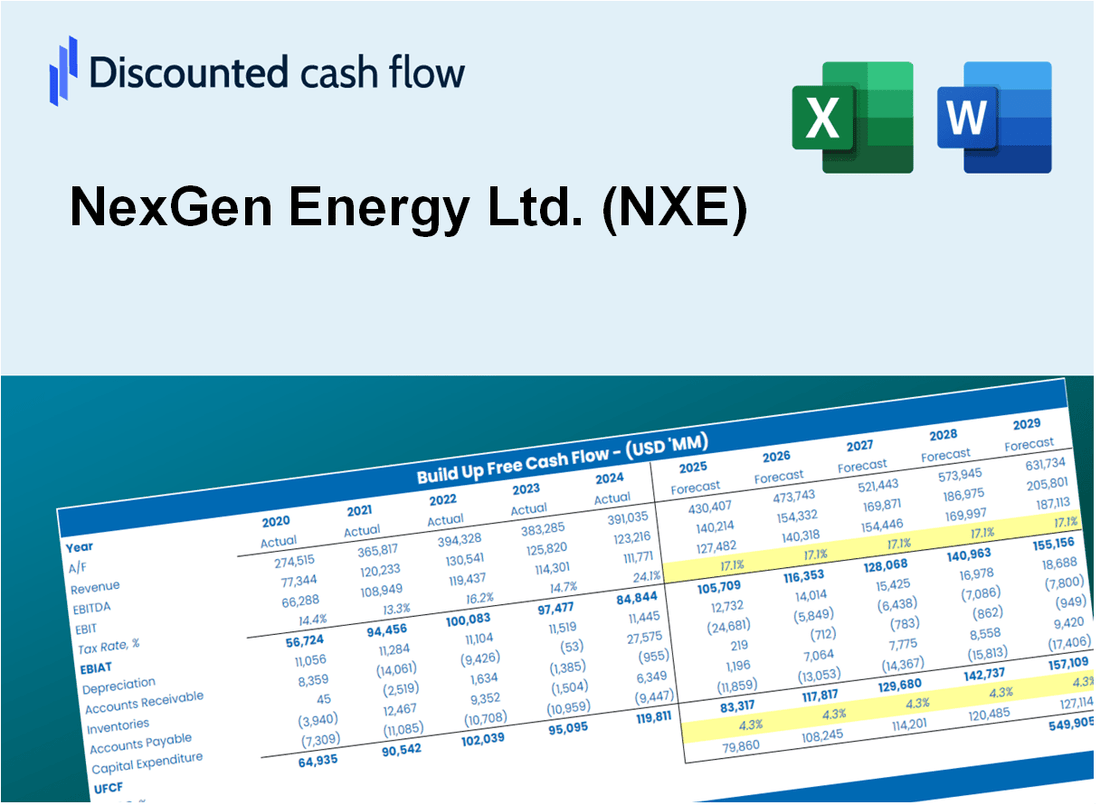
Avalie a perspectiva financeira da Nexgen Energy Ltd. (NXE) com experiência! Esta calculadora DCF (NXE) fornece dados financeiros pré-preenchidos e total flexibilidade para modificar o crescimento da receita, o WACC, as margens e outras suposições essenciais para se alinhar às suas projeções.
Discounted Cash Flow (DCF) - (USD MM)
| Year | AY1 2020 |
AY2 2021 |
AY3 2022 |
AY4 2023 |
AY5 2024 |
FY1 2025 |
FY2 2026 |
FY3 2027 |
FY4 2028 |
FY5 2029 |
|---|---|---|---|---|---|---|---|---|---|---|
| Revenue | .0 | .0 | .0 | .0 | .0 | .0 | .0 | .0 | .0 | .0 |
| Revenue Growth, % | 0 | 0 | 0 | 0 | 0 | 0 | 0 | 0 | 0 | 0 |
| EBITDA | -15.9 | -35.7 | -41.4 | -59.8 | -54.8 | .0 | .0 | .0 | .0 | .0 |
| EBITDA, % | 100 | 100 | 100 | 100 | 100 | 100 | 100 | 100 | 100 | 100 |
| Depreciation | 1.6 | 1.5 | 1.3 | .7 | 1.0 | .0 | .0 | .0 | .0 | .0 |
| Depreciation, % | 100 | 100 | 100 | 100 | 100 | 100 | 100 | 100 | 100 | 100 |
| EBIT | -17.5 | -37.2 | -42.7 | -60.5 | -55.8 | .0 | .0 | .0 | .0 | .0 |
| EBIT, % | 100 | 100 | 100 | 100 | 100 | 100 | 100 | 100 | 100 | 100 |
| Total Cash | 52.8 | 150.7 | 100.1 | 207.5 | 340.2 | .0 | .0 | .0 | .0 | .0 |
| Total Cash, percent | .0 | .0 | .0 | .0 | .0 | .0 | .0 | .0 | .0 | .0 |
| Account Receivables | .0 | .0 | 1.3 | .4 | 1.6 | .0 | .0 | .0 | .0 | .0 |
| Account Receivables, % | 100 | 100 | 100 | 100 | 100 | 100 | 100 | 100 | 100 | 100 |
| Inventories | .0 | .0 | .0 | .0 | .0 | .0 | .0 | .0 | .0 | .0 |
| Inventories, % | 100 | 100 | 100 | 100 | 100 | 100 | 100 | 100 | 100 | 100 |
| Accounts Payable | .0 | .0 | .0 | 19.2 | 15.2 | .0 | .0 | .0 | .0 | .0 |
| Accounts Payable, % | 100 | 100 | 100 | 100 | 100 | 100 | 100 | 100 | 100 | 100 |
| Capital Expenditure | -13.0 | -33.5 | -.3 | -4.3 | -93.3 | .0 | .0 | .0 | .0 | .0 |
| Capital Expenditure, % | 100 | 100 | 100 | 100 | 100 | 0 | 0 | 0 | 0 | 0 |
| Tax Rate, % | 5.56 | 5.56 | 5.56 | 5.56 | 5.56 | 5.56 | 5.56 | 5.56 | 5.56 | 5.56 |
| EBITAT | -16.9 | -35.2 | -39.4 | -71.1 | -52.7 | .0 | .0 | .0 | .0 | .0 |
| Depreciation | ||||||||||
| Changes in Account Receivables | ||||||||||
| Changes in Inventories | ||||||||||
| Changes in Accounts Payable | ||||||||||
| Capital Expenditure | ||||||||||
| UFCF | -28.3 | -67.2 | -39.7 | -54.6 | -150.2 | -13.6 | .0 | .0 | .0 | .0 |
| WACC, % | 11.47 | 11.46 | 11.46 | 11.47 | 11.46 | 11.46 | 11.46 | 11.46 | 11.46 | 11.46 |
| PV UFCF | ||||||||||
| SUM PV UFCF | -12.2 | |||||||||
| Long Term Growth Rate, % | 2.00 | |||||||||
| Free cash flow (T + 1) | 0 | |||||||||
| Terminal Value | 0 | |||||||||
| Present Terminal Value | 0 | |||||||||
| Enterprise Value | -12 | |||||||||
| Net Debt | -14 | |||||||||
| Equity Value | 2 | |||||||||
| Diluted Shares Outstanding, MM | 555 | |||||||||
| Equity Value Per Share | 0.00 |
What You Will Get
- Comprehensive NXE Financials: Access historical and projected data for precise valuation.
- Customizable Inputs: Adjust discount rates, tax assumptions, production forecasts, and capital investments.
- Real-Time Calculations: Intrinsic value and NPV are computed automatically.
- Scenario Testing: Analyze various scenarios to assess NexGen Energy's potential outcomes.
- User-Friendly Interface: Designed for industry experts while remaining approachable for newcomers.
Key Features
- Comprehensive DCF Calculator: Features detailed unlevered and levered DCF valuation models tailored for NexGen Energy Ltd. (NXE).
- WACC Calculator: Pre-configured Weighted Average Cost of Capital sheet with adjustable inputs specific to the energy sector.
- Customizable Forecast Assumptions: Adjust growth rates, capital expenditures, and discount rates to fit NexGen’s financial outlook.
- Integrated Financial Ratios: Evaluate profitability, leverage, and efficiency ratios relevant to NexGen Energy Ltd. (NXE).
- Interactive Dashboard and Charts: Visual representations summarize essential valuation metrics for straightforward analysis.
How It Works
- Step 1: Download the Excel file.
- Step 2: Review NexGen Energy Ltd.'s (NXE) pre-filled financial data and forecasts.
- Step 3: Modify key inputs such as production estimates, discount rates, and operational costs (highlighted cells).
- Step 4: Observe the DCF model update in real-time as you adjust your assumptions.
- Step 5: Evaluate the outputs and leverage the results for your investment strategies.
Why Choose NexGen Energy Ltd. (NXE) Calculator?
- Precision: Utilizes real NexGen financial data for reliable results.
- Versatility: Crafted for users to experiment with and adjust inputs effortlessly.
- Efficiency: Eliminate the need to create a financial model from the ground up.
- Expert-Quality: Engineered with the accuracy and usability expected by industry professionals.
- Intuitive: Simple interface designed for users of all financial backgrounds.
Who Should Use This Product?
- Energy Students: Explore renewable energy valuation techniques using real-time data.
- Researchers: Integrate advanced models into your studies on energy markets and sustainability.
- Investors: Validate your investment strategies and analyze valuation outcomes for NexGen Energy Ltd. (NXE).
- Market Analysts: Enhance your analysis with a tailored, user-friendly DCF model specific to the energy sector.
- Entrepreneurs: Understand how publicly traded companies like NexGen Energy Ltd. (NXE) are evaluated in the market.
What the Template Contains
- Pre-Filled Data: Includes NexGen Energy Ltd.'s historical financials and projections.
- Discounted Cash Flow Model: Editable DCF valuation model with automatic calculations.
- Weighted Average Cost of Capital (WACC): A dedicated sheet for calculating WACC based on custom inputs.
- Key Financial Ratios: Analyze NexGen Energy Ltd.'s profitability, efficiency, and leverage.
- Customizable Inputs: Edit revenue growth, margins, and tax rates with ease.
- Clear Dashboard: Charts and tables summarizing key valuation results.
Disclaimer
All information, articles, and product details provided on this website are for general informational and educational purposes only. We do not claim any ownership over, nor do we intend to infringe upon, any trademarks, copyrights, logos, brand names, or other intellectual property mentioned or depicted on this site. Such intellectual property remains the property of its respective owners, and any references here are made solely for identification or informational purposes, without implying any affiliation, endorsement, or partnership.
We make no representations or warranties, express or implied, regarding the accuracy, completeness, or suitability of any content or products presented. Nothing on this website should be construed as legal, tax, investment, financial, medical, or other professional advice. In addition, no part of this site—including articles or product references—constitutes a solicitation, recommendation, endorsement, advertisement, or offer to buy or sell any securities, franchises, or other financial instruments, particularly in jurisdictions where such activity would be unlawful.
All content is of a general nature and may not address the specific circumstances of any individual or entity. It is not a substitute for professional advice or services. Any actions you take based on the information provided here are strictly at your own risk. You accept full responsibility for any decisions or outcomes arising from your use of this website and agree to release us from any liability in connection with your use of, or reliance upon, the content or products found herein.