
|
Próximo PLC (NXT.L) Avaliação DCF |
Totalmente Editável: Adapte-Se Às Suas Necessidades No Excel Ou Planilhas
Design Profissional: Modelos Confiáveis E Padrão Da Indústria
Pré-Construídos Para Uso Rápido E Eficiente
Compatível com MAC/PC, totalmente desbloqueado
Não É Necessária Experiência; Fácil De Seguir
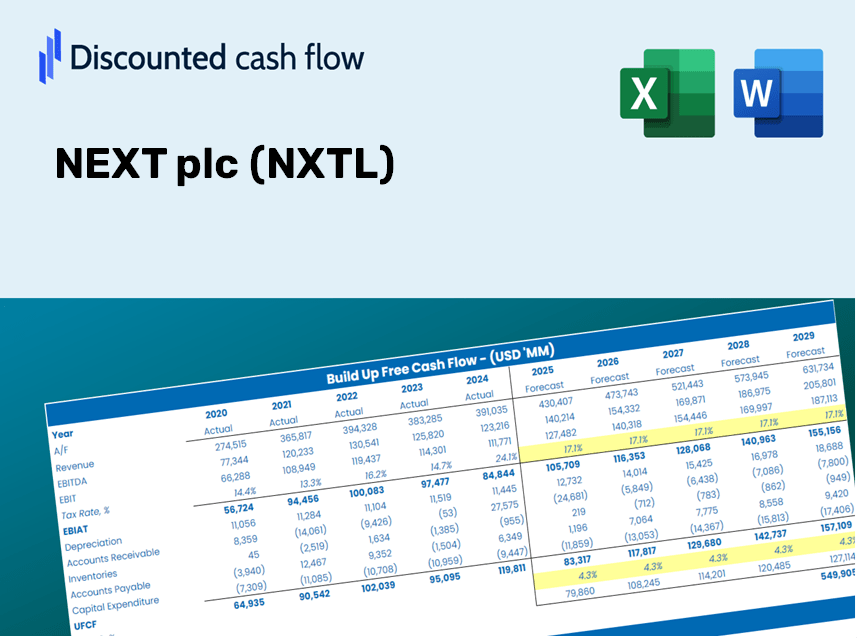
NEXT plc (NXT.L) Bundle
Descubra o verdadeiro potencial do Next PLC com nossa calculadora DCF de nível profissional! Ajuste as principais suposições, explore vários cenários e avalie como as mudanças afetam a avaliação da próxima plc (NXTL) - tudo dentro de um único modelo do Excel.
Discounted Cash Flow (DCF) - (USD MM)
| Year | AY1 2021 |
AY2 2022 |
AY3 2023 |
AY4 2024 |
AY5 2025 |
FY1 2026 |
FY2 2027 |
FY3 2028 |
FY4 2029 |
FY5 2030 |
|---|---|---|---|---|---|---|---|---|---|---|
| Revenue | 3,534.4 | 4,625.9 | 5,034.0 | 5,491.0 | 6,118.1 | 7,038.9 | 8,098.3 | 9,317.2 | 10,719.5 | 12,332.9 |
| Revenue Growth, % | 0 | 30.88 | 8.82 | 9.08 | 11.42 | 15.05 | 15.05 | 15.05 | 15.05 | 15.05 |
| EBITDA | 700.3 | 1,125.5 | 1,152.9 | 1,345.2 | 1,394.6 | 1,609.7 | 1,851.9 | 2,130.6 | 2,451.3 | 2,820.3 |
| EBITDA, % | 19.81 | 24.33 | 22.9 | 24.5 | 22.79 | 22.87 | 22.87 | 22.87 | 22.87 | 22.87 |
| Depreciation | 255.6 | 220.7 | 220.0 | 246.0 | 311.0 | 365.1 | 420.1 | 483.3 | 556.0 | 639.7 |
| Depreciation, % | 7.23 | 4.77 | 4.37 | 4.48 | 5.08 | 5.19 | 5.19 | 5.19 | 5.19 | 5.19 |
| EBIT | 444.7 | 904.8 | 932.9 | 1,099.2 | 1,083.6 | 1,244.5 | 1,431.8 | 1,647.3 | 1,895.3 | 2,180.5 |
| EBIT, % | 12.58 | 19.56 | 18.53 | 20.02 | 17.71 | 17.68 | 17.68 | 17.68 | 17.68 | 17.68 |
| Total Cash | 619.3 | 468.5 | 105.0 | 188.3 | 200.4 | 513.0 | 590.2 | 679.0 | 781.2 | 898.8 |
| Total Cash, percent | .0 | .0 | .0 | .0 | .0 | .0 | .0 | .0 | .0 | .0 |
| Account Receivables | 1,100.9 | 1,227.8 | 1,370.6 | 1,419.9 | 1,440.1 | 1,890.8 | 2,175.4 | 2,502.9 | 2,879.6 | 3,313.0 |
| Account Receivables, % | 31.15 | 26.54 | 27.23 | 25.86 | 23.54 | 26.86 | 26.86 | 26.86 | 26.86 | 26.86 |
| Inventories | 536.9 | 633.0 | 662.2 | 769.0 | 865.2 | 987.9 | 1,136.6 | 1,307.7 | 1,504.5 | 1,730.9 |
| Inventories, % | 15.19 | 13.68 | 13.15 | 14 | 14.14 | 14.04 | 14.04 | 14.04 | 14.04 | 14.04 |
| Accounts Payable | 172.6 | 275.4 | 230.1 | 297.1 | 355.8 | 374.9 | 431.4 | 496.3 | 571.0 | 656.9 |
| Accounts Payable, % | 4.88 | 5.95 | 4.57 | 5.41 | 5.82 | 5.33 | 5.33 | 5.33 | 5.33 | 5.33 |
| Capital Expenditure | -163.0 | -266.3 | -246.1 | -188.2 | -157.5 | -299.3 | -344.3 | -396.1 | -455.8 | -524.4 |
| Capital Expenditure, % | -4.61 | -5.76 | -4.89 | -3.43 | -2.57 | -4.25 | -4.25 | -4.25 | -4.25 | -4.25 |
| Tax Rate, % | 25.42 | 25.42 | 25.42 | 25.42 | 25.42 | 25.42 | 25.42 | 25.42 | 25.42 | 25.42 |
| EBITAT | 372.9 | 744.7 | 763.8 | 868.2 | 808.1 | 999.6 | 1,150.0 | 1,323.1 | 1,522.3 | 1,751.4 |
| Depreciation | ||||||||||
| Changes in Account Receivables | ||||||||||
| Changes in Inventories | ||||||||||
| Changes in Accounts Payable | ||||||||||
| Capital Expenditure | ||||||||||
| UFCF | -999.7 | 578.9 | 520.4 | 836.9 | 903.9 | 511.1 | 849.0 | 976.7 | 1,123.7 | 1,292.9 |
| WACC, % | 8.44 | 8.43 | 8.43 | 8.41 | 8.39 | 8.42 | 8.42 | 8.42 | 8.42 | 8.42 |
| PV UFCF | ||||||||||
| SUM PV UFCF | 3,636.4 | |||||||||
| Long Term Growth Rate, % | 2.00 | |||||||||
| Free cash flow (T + 1) | 1,319 | |||||||||
| Terminal Value | 20,546 | |||||||||
| Present Terminal Value | 13,715 | |||||||||
| Enterprise Value | 17,352 | |||||||||
| Net Debt | 1,668 | |||||||||
| Equity Value | 15,683 | |||||||||
| Diluted Shares Outstanding, MM | 123 | |||||||||
| Equity Value Per Share | 12,802.68 |
What You'll Receive
- Modifiable Forecast Inputs: Effortlessly adjust key assumptions (growth %, margins, WACC) to explore various scenarios.
- Real-Time Data: NEXT plc’s financial information pre-loaded to kickstart your analysis.
- Automated DCF Outputs: The model calculates Net Present Value (NPV) and intrinsic value automatically.
- Customizable and Professional Design: A sophisticated Excel template that caters to your valuation requirements.
- Designed for Analysts and Investors: Perfect for evaluating projections, confirming strategies, and enhancing efficiency.
Key Features
- Customizable Forecast Inputs: Adjust essential metrics such as revenue growth, EBITDA %, and capital expenditures to fit your analysis.
- Instant DCF Valuation: Quickly computes intrinsic value, NPV, and additional financial metrics.
- High-Precision Accuracy: Leverages NEXT plc's (NXTL) actual financial data for dependable valuation results.
- Simplified Scenario Analysis: Effortlessly explore various assumptions and assess their impacts.
- Efficiency Booster: Save time by avoiding the creation of intricate valuation models from the ground up.
How It Functions
- Step 1: Download the preformatted Excel template containing NEXT plc's (NXTL) data.
- Step 2: Review the pre-filled sheets to familiarize yourself with essential metrics.
- Step 3: Modify forecasts and assumptions in the editable yellow cells (WACC, growth, margins).
- Step 4: Instantly see the updated results, including the intrinsic value of NEXT plc (NXTL).
- Step 5: Use the outputs to make well-informed investment decisions or create reports.
Why Opt for the NEXT plc (NXTL) Calculator?
- Precision: Utilizes authentic NEXT plc financial data for reliable results.
- Versatility: Allows users to easily experiment with and adjust inputs.
- Efficiency: Eliminate the challenges of constructing a DCF model from the ground up.
- Expert-Level: Crafted with the accuracy and functionality expected at the CFO level.
- Intuitive: Simple to navigate, even for individuals with limited financial modeling experience.
Who Should Utilize NEXT plc (NXTL)?
- Investors: Assess NEXT plc’s valuation prior to making stock transactions.
- CFOs and Financial Analysts: Enhance valuation workflows and evaluate financial projections.
- Startup Founders: Gain insights into how leading public companies like NEXT plc are valued.
- Consultants: Provide expert valuation reports for your client base.
- Students and Educators: Apply real-life data to refine and teach valuation methodologies.
What the Template Includes
- Operating and Balance Sheet Data: Pre-filled NEXT plc historical data and forecasts, covering revenue, EBITDA, EBIT, and capital expenditures.
- WACC Calculation: A dedicated sheet for calculating the Weighted Average Cost of Capital (WACC), featuring parameters such as Beta, risk-free rate, and share price.
- DCF Valuation (Unlevered and Levered): Customizable Discounted Cash Flow models that reveal intrinsic value through detailed calculations.
- Financial Statements: Pre-loaded financial statements (annual and quarterly) to facilitate thorough analysis.
- Key Ratios: Incorporates profitability, leverage, and efficiency ratios specific to NEXT plc (NXTL).
- Dashboard and Charts: Visual representation of valuation outputs and assumptions, designed for easy analysis of results.
Disclaimer
All information, articles, and product details provided on this website are for general informational and educational purposes only. We do not claim any ownership over, nor do we intend to infringe upon, any trademarks, copyrights, logos, brand names, or other intellectual property mentioned or depicted on this site. Such intellectual property remains the property of its respective owners, and any references here are made solely for identification or informational purposes, without implying any affiliation, endorsement, or partnership.
We make no representations or warranties, express or implied, regarding the accuracy, completeness, or suitability of any content or products presented. Nothing on this website should be construed as legal, tax, investment, financial, medical, or other professional advice. In addition, no part of this site—including articles or product references—constitutes a solicitation, recommendation, endorsement, advertisement, or offer to buy or sell any securities, franchises, or other financial instruments, particularly in jurisdictions where such activity would be unlawful.
All content is of a general nature and may not address the specific circumstances of any individual or entity. It is not a substitute for professional advice or services. Any actions you take based on the information provided here are strictly at your own risk. You accept full responsibility for any decisions or outcomes arising from your use of this website and agree to release us from any liability in connection with your use of, or reliance upon, the content or products found herein.