
|
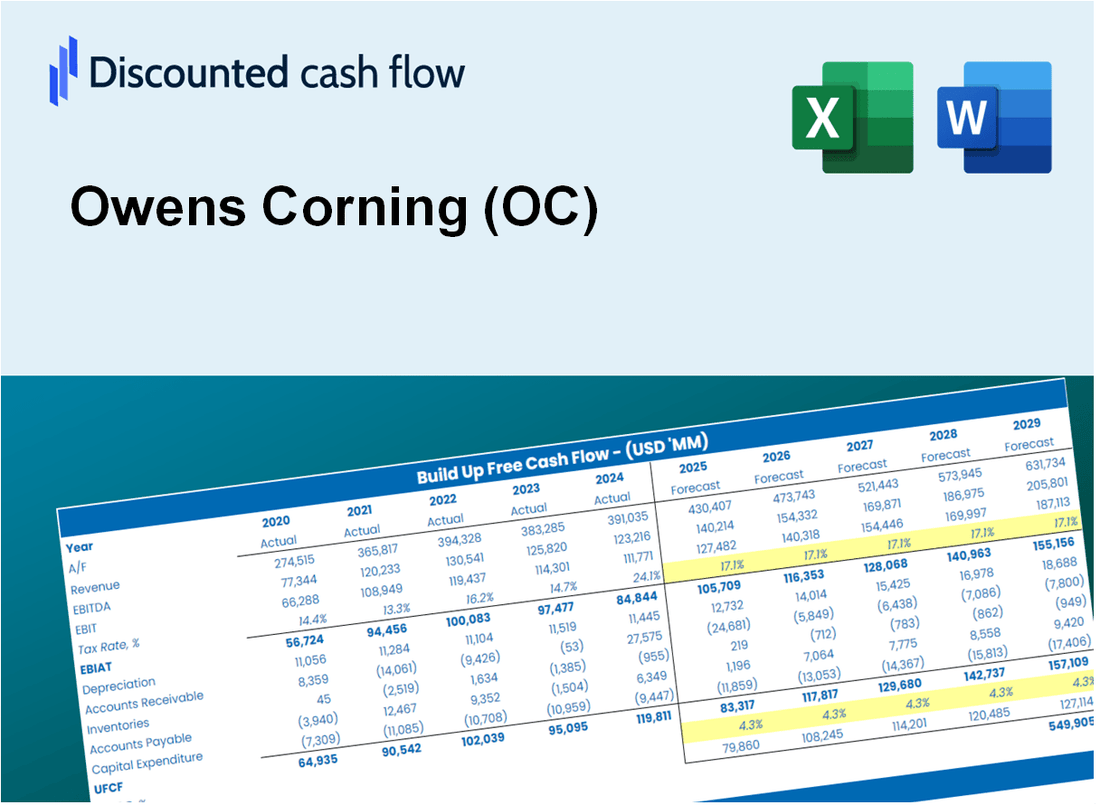
Avaliação DCF de Owens Corning (OC) |
Totalmente Editável: Adapte-Se Às Suas Necessidades No Excel Ou Planilhas
Design Profissional: Modelos Confiáveis E Padrão Da Indústria
Pré-Construídos Para Uso Rápido E Eficiente
Compatível com MAC/PC, totalmente desbloqueado
Não É Necessária Experiência; Fácil De Seguir
Owens Corning (OC) Bundle
Procurando determinar o valor intrínseco de Owens Corning? Nossa calculadora OC DCF integra dados reais com recursos abrangentes de personalização, permitindo refinar suas previsões e fazer escolhas de investimento mais informadas.
Discounted Cash Flow (DCF) - (USD MM)
| Year | AY1 2020 |
AY2 2021 |
AY3 2022 |
AY4 2023 |
AY5 2024 |
FY1 2025 |
FY2 2026 |
FY3 2027 |
FY4 2028 |
FY5 2029 |
|---|---|---|---|---|---|---|---|---|---|---|
| Revenue | 7,055.0 | 8,498.0 | 9,761.0 | 9,677.0 | 10,975.0 | 12,288.4 | 13,759.0 | 15,405.5 | 17,249.1 | 19,313.3 |
| Revenue Growth, % | 0 | 20.45 | 14.86 | -0.86057 | 13.41 | 11.97 | 11.97 | 11.97 | 11.97 | 11.97 |
| EBITDA | 341.0 | 1,909.0 | 2,070.0 | 2,166.0 | 1,749.0 | 2,133.8 | 2,389.2 | 2,675.1 | 2,995.3 | 3,353.7 |
| EBITDA, % | 4.83 | 22.46 | 21.21 | 22.38 | 15.94 | 17.36 | 17.36 | 17.36 | 17.36 | 17.36 |
| Depreciation | 457.0 | 465.0 | 476.0 | 499.0 | 622.0 | 679.6 | 760.9 | 851.9 | 953.9 | 1,068.0 |
| Depreciation, % | 6.48 | 5.47 | 4.88 | 5.16 | 5.67 | 5.53 | 5.53 | 5.53 | 5.53 | 5.53 |
| EBIT | -116.0 | 1,444.0 | 1,594.0 | 1,667.0 | 1,127.0 | 1,454.3 | 1,628.3 | 1,823.2 | 2,041.4 | 2,285.7 |
| EBIT, % | -1.64 | 16.99 | 16.33 | 17.23 | 10.27 | 11.83 | 11.83 | 11.83 | 11.83 | 11.83 |
| Total Cash | 717.0 | 959.0 | 1,099.0 | 1,615.0 | 361.0 | 1,294.8 | 1,449.8 | 1,623.3 | 1,817.6 | 2,035.1 |
| Total Cash, percent | .0 | .0 | .0 | .0 | .0 | .0 | .0 | .0 | .0 | .0 |
| Account Receivables | 919.0 | 939.0 | 961.0 | 987.0 | 1,244.0 | 1,362.9 | 1,526.0 | 1,708.6 | 1,913.1 | 2,142.1 |
| Account Receivables, % | 13.03 | 11.05 | 9.85 | 10.2 | 11.33 | 11.09 | 11.09 | 11.09 | 11.09 | 11.09 |
| Inventories | 855.0 | 1,078.0 | 1,334.0 | 1,198.0 | 1,587.0 | 1,605.1 | 1,797.2 | 2,012.3 | 2,253.1 | 2,522.7 |
| Inventories, % | 12.12 | 12.69 | 13.67 | 12.38 | 14.46 | 13.06 | 13.06 | 13.06 | 13.06 | 13.06 |
| Accounts Payable | 875.0 | 1,095.0 | 1,345.0 | 1,216.0 | 1,430.0 | 1,589.2 | 1,779.4 | 1,992.3 | 2,230.8 | 2,497.7 |
| Accounts Payable, % | 12.4 | 12.89 | 13.78 | 12.57 | 13.03 | 12.93 | 12.93 | 12.93 | 12.93 | 12.93 |
| Capital Expenditure | -307.0 | -416.0 | -446.0 | -526.0 | -647.0 | -618.0 | -692.0 | -774.8 | -867.5 | -971.3 |
| Capital Expenditure, % | -4.35 | -4.9 | -4.57 | -5.44 | -5.9 | -5.03 | -5.03 | -5.03 | -5.03 | -5.03 |
| Tax Rate, % | 29.83 | 29.83 | 29.83 | 29.83 | 29.83 | 29.83 | 29.83 | 29.83 | 29.83 | 29.83 |
| EBITAT | -173.5 | 1,093.4 | 1,225.6 | 1,250.8 | 790.9 | 1,157.1 | 1,295.6 | 1,450.6 | 1,624.2 | 1,818.6 |
| Depreciation | ||||||||||
| Changes in Account Receivables | ||||||||||
| Changes in Inventories | ||||||||||
| Changes in Accounts Payable | ||||||||||
| Capital Expenditure | ||||||||||
| UFCF | -922.5 | 1,119.4 | 1,227.6 | 1,204.8 | 333.9 | 1,240.8 | 1,199.4 | 1,343.0 | 1,503.7 | 1,683.6 |
| WACC, % | 7.61 | 7.25 | 7.27 | 7.24 | 7.17 | 7.31 | 7.31 | 7.31 | 7.31 | 7.31 |
| PV UFCF | ||||||||||
| SUM PV UFCF | 5,602.1 | |||||||||
| Long Term Growth Rate, % | 2.00 | |||||||||
| Free cash flow (T + 1) | 1,717 | |||||||||
| Terminal Value | 32,356 | |||||||||
| Present Terminal Value | 22,740 | |||||||||
| Enterprise Value | 28,342 | |||||||||
| Net Debt | 5,255 | |||||||||
| Equity Value | 23,087 | |||||||||
| Diluted Shares Outstanding, MM | 88 | |||||||||
| Equity Value Per Share | 262.66 |
What You Will Get
- Real OC Financial Data: Pre-filled with Owens Corning’s historical and projected data for precise analysis.
- Fully Editable Template: Modify key inputs like revenue growth, WACC, and EBITDA % with ease.
- Automatic Calculations: See Owens Corning’s intrinsic value update instantly based on your changes.
- Professional Valuation Tool: Designed for investors, analysts, and consultants seeking accurate DCF results.
- User-Friendly Design: Simple structure and clear instructions for all experience levels.
Key Features
- Genuine Owens Corning Financials: Access reliable pre-loaded historical data and future forecasts.
- Adjustable Forecast Assumptions: Modify yellow-highlighted cells such as WACC, growth rates, and profit margins.
- Real-Time Calculations: Automatic adjustments to DCF, Net Present Value (NPV), and cash flow assessments.
- Interactive Dashboard: User-friendly charts and summaries to help visualize your valuation outcomes.
- Suitable for All Experience Levels: An intuitive layout designed for investors, CFOs, and consultants alike.
How It Works
- Step 1: Download the Excel file.
- Step 2: Review Owens Corning’s pre-filled financial data and forecasts.
- Step 3: Modify critical inputs like revenue growth, WACC, and tax rates (highlighted cells).
- Step 4: Watch the DCF model update instantly as you tweak assumptions.
- Step 5: Analyze the outputs and use the results for investment decisions.
Why Choose This Calculator for Owens Corning (OC)?
- All-in-One Solution: Features DCF, WACC, and financial ratio analyses tailored for Owens Corning (OC).
- Flexible Inputs: Modify yellow-highlighted fields to explore different investment scenarios.
- In-Depth Analysis: Automatically computes Owens Corning’s intrinsic value and Net Present Value.
- Integrated Data: Comes with historical and projected data for precise calculations.
- High-Quality Standards: Perfect for financial analysts, investors, and business advisors focused on Owens Corning (OC).
Who Should Use This Product?
- Construction Students: Understand material evaluation techniques and apply them using real-world data.
- Researchers: Integrate industry models into academic projects or studies.
- Investors: Validate your own assumptions and assess valuation outcomes for Owens Corning (OC) stock.
- Market Analysts: Enhance your efficiency with a ready-to-use, customizable financial model.
- Contractors: Acquire knowledge on how major companies like Owens Corning (OC) are evaluated in the market.
What the Template Contains
- Pre-Filled Data: Includes Owens Corning’s historical financials and forecasts.
- Discounted Cash Flow Model: Editable DCF valuation model with automatic calculations.
- Weighted Average Cost of Capital (WACC): A dedicated sheet for calculating WACC based on custom inputs.
- Key Financial Ratios: Analyze Owens Corning’s profitability, efficiency, and leverage.
- Customizable Inputs: Edit revenue growth, margins, and tax rates with ease.
- Clear Dashboard: Charts and tables summarizing key valuation results.
Disclaimer
All information, articles, and product details provided on this website are for general informational and educational purposes only. We do not claim any ownership over, nor do we intend to infringe upon, any trademarks, copyrights, logos, brand names, or other intellectual property mentioned or depicted on this site. Such intellectual property remains the property of its respective owners, and any references here are made solely for identification or informational purposes, without implying any affiliation, endorsement, or partnership.
We make no representations or warranties, express or implied, regarding the accuracy, completeness, or suitability of any content or products presented. Nothing on this website should be construed as legal, tax, investment, financial, medical, or other professional advice. In addition, no part of this site—including articles or product references—constitutes a solicitation, recommendation, endorsement, advertisement, or offer to buy or sell any securities, franchises, or other financial instruments, particularly in jurisdictions where such activity would be unlawful.
All content is of a general nature and may not address the specific circumstances of any individual or entity. It is not a substitute for professional advice or services. Any actions you take based on the information provided here are strictly at your own risk. You accept full responsibility for any decisions or outcomes arising from your use of this website and agree to release us from any liability in connection with your use of, or reliance upon, the content or products found herein.