
|
OCI N.V. (OCI.AS) Avaliação DCF |
Totalmente Editável: Adapte-Se Às Suas Necessidades No Excel Ou Planilhas
Design Profissional: Modelos Confiáveis E Padrão Da Indústria
Pré-Construídos Para Uso Rápido E Eficiente
Compatível com MAC/PC, totalmente desbloqueado
Não É Necessária Experiência; Fácil De Seguir
OCI N.V. (OCI.AS) Bundle
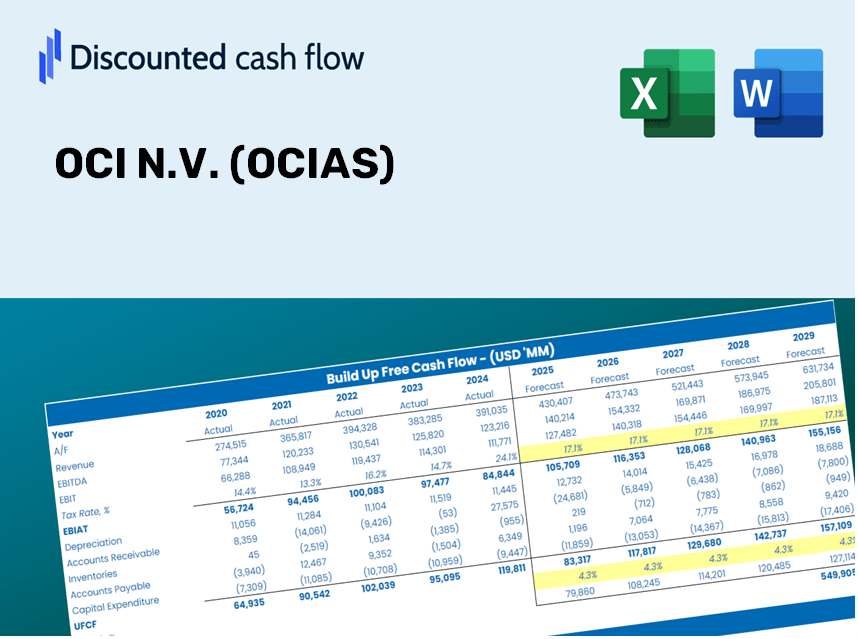
Procurando avaliar o valor intrínseco do OCI N.V.? Nossa calculadora DCF (OCIAS) integra dados do mundo real com extensos recursos de personalização, permitindo refinar suas previsões e fazer escolhas de investimento mais informadas.
Discounted Cash Flow (DCF) - (USD MM)
| Year | AY1 2020 |
AY2 2021 |
AY3 2022 |
AY4 2023 |
AY5 2024 |
FY1 2025 |
FY2 2026 |
FY3 2027 |
FY4 2028 |
FY5 2029 |
|---|---|---|---|---|---|---|---|---|---|---|
| Revenue | 2,996.3 | 5,449.7 | 3,202.9 | 1,692.7 | 841.0 | 721.5 | 619.1 | 531.1 | 455.7 | 391.0 |
| Revenue Growth, % | 0 | 81.88 | -41.23 | -47.15 | -50.32 | -14.2 | -14.2 | -14.2 | -14.2 | -14.2 |
| EBITDA | 688.9 | 2,129.0 | 487.6 | -124.2 | 33.6 | 106.7 | 91.5 | 78.5 | 67.4 | 57.8 |
| EBITDA, % | 22.99 | 39.07 | 15.22 | -7.34 | 3.99 | 14.79 | 14.79 | 14.79 | 14.79 | 14.79 |
| Depreciation | 510.8 | 769.0 | 153.5 | 81.0 | 92.4 | 74.6 | 64.0 | 54.9 | 47.1 | 40.4 |
| Depreciation, % | 17.05 | 14.11 | 4.79 | 4.78 | 10.98 | 10.34 | 10.34 | 10.34 | 10.34 | 10.34 |
| EBIT | 178.2 | 1,360.0 | 334.0 | -205.2 | -58.8 | 32.1 | 27.5 | 23.6 | 20.2 | 17.4 |
| EBIT, % | 5.95 | 24.96 | 10.43 | -12.12 | -6.99 | 4.44 | 4.44 | 4.44 | 4.44 | 4.44 |
| Total Cash | 545.3 | 1,241.5 | 1,459.5 | 135.3 | 1,770.6 | 280.7 | 240.9 | 206.7 | 177.3 | 152.1 |
| Total Cash, percent | .0 | .0 | .0 | .0 | .0 | .0 | .0 | .0 | .0 | .0 |
| Account Receivables | 518.3 | 734.5 | 707.4 | 315.2 | 568.2 | 200.7 | 172.2 | 147.7 | 126.7 | 108.7 |
| Account Receivables, % | 17.3 | 13.48 | 22.09 | 18.62 | 67.56 | 27.81 | 27.81 | 27.81 | 27.81 | 27.81 |
| Inventories | 253.4 | 296.3 | 363.4 | 134.5 | 119.0 | 68.3 | 58.6 | 50.3 | 43.1 | 37.0 |
| Inventories, % | 8.46 | 5.44 | 11.35 | 7.94 | 14.15 | 9.47 | 9.47 | 9.47 | 9.47 | 9.47 |
| Accounts Payable | 865.6 | 1,170.8 | 1,107.7 | 579.0 | 824.6 | 313.5 | 268.9 | 230.7 | 198.0 | 169.8 |
| Accounts Payable, % | 28.89 | 21.48 | 34.58 | 34.2 | 98.05 | 43.44 | 43.44 | 43.44 | 43.44 | 43.44 |
| Capital Expenditure | -227.0 | -214.7 | -339.9 | -141.9 | -65.8 | -55.3 | -47.5 | -40.7 | -34.9 | -30.0 |
| Capital Expenditure, % | -7.58 | -3.94 | -10.61 | -8.38 | -7.82 | -7.67 | -7.67 | -7.67 | -7.67 | -7.67 |
| Tax Rate, % | 3261.14 | 3261.14 | 3261.14 | 3261.14 | 3261.14 | 3261.14 | 3261.14 | 3261.14 | 3261.14 | 3261.14 |
| EBITAT | 638.4 | 598.7 | 1,133.7 | -145.9 | 1,859.4 | 20.2 | 17.3 | 14.9 | 12.8 | 10.9 |
| Depreciation | ||||||||||
| Changes in Account Receivables | ||||||||||
| Changes in Inventories | ||||||||||
| Changes in Accounts Payable | ||||||||||
| Capital Expenditure | ||||||||||
| UFCF | 1,016.1 | 1,199.2 | 844.0 | -114.4 | 1,894.1 | -53.4 | 27.6 | 23.7 | 20.3 | 17.4 |
| WACC, % | 8.03 | 5 | 8.03 | 6.47 | 2.61 | 6.03 | 6.03 | 6.03 | 6.03 | 6.03 |
| PV UFCF | ||||||||||
| SUM PV UFCF | 23.1 | |||||||||
| Long Term Growth Rate, % | 0.50 | |||||||||
| Free cash flow (T + 1) | 18 | |||||||||
| Terminal Value | 317 | |||||||||
| Present Terminal Value | 236 | |||||||||
| Enterprise Value | 259 | |||||||||
| Net Debt | -1,077 | |||||||||
| Equity Value | 1,337 | |||||||||
| Diluted Shares Outstanding, MM | 212 | |||||||||
| Equity Value Per Share | 6.32 |
Benefits You Will Receive
- Customizable Excel Template: A fully adaptable Excel-based DCF Calculator featuring pre-filled real OCI N.V. (OCIAS) financial data.
- Actual Financial Data: Access to historical figures and forward-looking projections (highlighted in the yellow cells).
- Forecasting Flexibility: Adjust key assumptions such as revenue growth, EBITDA percentage, and WACC as needed.
- Real-Time Calculations: Instantly observe how your inputs affect the valuation of OCI N.V. (OCIAS).
- Professional Resource: Designed for investors, CFOs, consultants, and financial analysts.
- Intuitive Interface: Organized for clarity and user-friendliness, complete with step-by-step guidance.
Key Features
- Customizable Financial Inputs: Adjust essential parameters such as revenue growth, EBITDA %, and capital expenditures.
- Instant DCF Valuation: Automatically computes intrinsic value, NPV, and additional metrics with ease.
- High-Precision Outputs: Leverages OCI N.V.’s real financial data for accurate valuation results.
- Simplified Scenario Analysis: Effortlessly explore various assumptions and assess different outcomes.
- Efficiency Booster: Remove the complexity of building valuation models from the ground up.
How It Operates
- Step 1: Download the Excel spreadsheet.
- Step 2: Examine the pre-filled OCI N.V. (OCIAS) data (both historical and forecasted).
- Step 3: Modify key assumptions (highlighted in yellow) according to your analysis.
- Step 4: Observe automatic recalculations for OCI N.V.'s intrinsic value.
- Step 5: Utilize the results for investment decisions or reporting purposes.
Why Select This Calculator for OCI N.V. (OCIAS)?
- All-in-One Tool: Combines DCF, WACC, and financial ratio analyses for a comprehensive evaluation.
- Adjustable Inputs: Modify the yellow-highlighted fields to explore different scenarios.
- In-Depth Analysis: Automatically computes OCI’s intrinsic value and Net Present Value.
- Pre-Loaded Data: Access historical and projected data for reliable starting points.
- Professional Standard: Perfect for financial analysts, investors, and business consultants.
Who Can Benefit from OCI N.V. (OCIAS)?
- Investors: Make informed decisions with our advanced valuation tool tailored for your needs.
- Financial Analysts: Streamline your workflow with a customizable DCF model that's ready to use.
- Consultants: Easily modify the template for impactful client presentations or detailed reports.
- Finance Enthusiasts: Enhance your comprehension of valuation methods through real-world scenarios.
- Educators and Students: Utilize this resource as a hands-on learning aid in finance courses.
Contents of the OCI N.V. Template
- Comprehensive DCF Model: An editable template featuring detailed valuation calculations tailored for OCI N.V. (OCIAS).
- Real-World Data: Historical and projected financials for OCI N.V. (OCIAS) preloaded to facilitate analysis.
- Customizable Parameters: Modify WACC, growth rates, and tax assumptions to explore various scenarios.
- Financial Statements: Complete annual and quarterly breakdowns for enhanced insights into OCI N.V. (OCIAS).
- Key Ratios: Built-in analytics for assessing profitability, efficiency, and leverage metrics.
- Dashboard with Visual Outputs: Intuitive charts and tables providing clear, actionable results for OCI N.V. (OCIAS).
Disclaimer
All information, articles, and product details provided on this website are for general informational and educational purposes only. We do not claim any ownership over, nor do we intend to infringe upon, any trademarks, copyrights, logos, brand names, or other intellectual property mentioned or depicted on this site. Such intellectual property remains the property of its respective owners, and any references here are made solely for identification or informational purposes, without implying any affiliation, endorsement, or partnership.
We make no representations or warranties, express or implied, regarding the accuracy, completeness, or suitability of any content or products presented. Nothing on this website should be construed as legal, tax, investment, financial, medical, or other professional advice. In addition, no part of this site—including articles or product references—constitutes a solicitation, recommendation, endorsement, advertisement, or offer to buy or sell any securities, franchises, or other financial instruments, particularly in jurisdictions where such activity would be unlawful.
All content is of a general nature and may not address the specific circumstances of any individual or entity. It is not a substitute for professional advice or services. Any actions you take based on the information provided here are strictly at your own risk. You accept full responsibility for any decisions or outcomes arising from your use of this website and agree to release us from any liability in connection with your use of, or reliance upon, the content or products found herein.