
|
Oddity Tech Ltd. (ODD) Avaliação DCF |
Totalmente Editável: Adapte-Se Às Suas Necessidades No Excel Ou Planilhas
Design Profissional: Modelos Confiáveis E Padrão Da Indústria
Pré-Construídos Para Uso Rápido E Eficiente
Compatível com MAC/PC, totalmente desbloqueado
Não É Necessária Experiência; Fácil De Seguir
Oddity Tech Ltd. (ODD) Bundle
Avalie as perspectivas financeiras da Oddity Tech Ltd. (ímpares) com precisão especializada! Essa calculadora (ímpar) fornece dados financeiros pré-preenchidos e permite personalizar totalmente o crescimento da receita, o WACC, as margens e outras suposições essenciais para se alinhar com suas projeções.
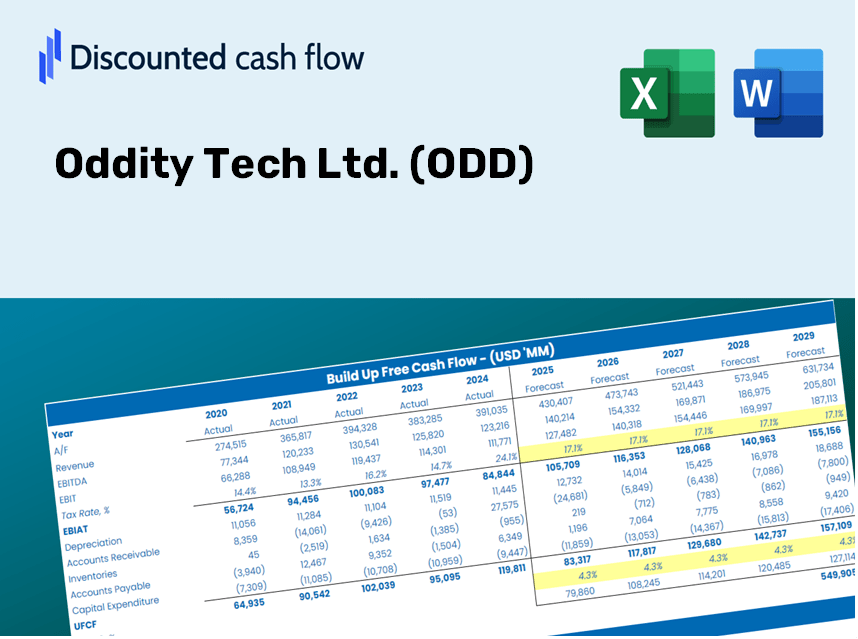
Discounted Cash Flow (DCF) - (USD MM)
| Year | AY1 2020 |
AY2 2021 |
AY3 2022 |
AY4 2023 |
AY5 2024 |
FY1 2025 |
FY2 2026 |
FY3 2027 |
FY4 2028 |
FY5 2029 |
|---|---|---|---|---|---|---|---|---|---|---|
| Revenue | 110.6 | 222.6 | 324.5 | 508.7 | 647.0 | 1,018.7 | 1,603.9 | 2,525.1 | 3,975.6 | 6,259.2 |
| Revenue Growth, % | 0 | 101.16 | 45.82 | 56.75 | 27.2 | 57.44 | 57.44 | 57.44 | 57.44 | 57.44 |
| EBITDA | 20.9 | 23.5 | 32.1 | 82.9 | 125.4 | 152.9 | 240.7 | 379.0 | 596.7 | 939.4 |
| EBITDA, % | 18.91 | 10.57 | 9.88 | 16.3 | 19.38 | 15.01 | 15.01 | 15.01 | 15.01 | 15.01 |
| Depreciation | 4.3 | 4.0 | 4.4 | 8.6 | 9.8 | 20.8 | 32.8 | 51.6 | 81.2 | 127.9 |
| Depreciation, % | 3.85 | 1.8 | 1.36 | 1.69 | 1.52 | 2.04 | 2.04 | 2.04 | 2.04 | 2.04 |
| EBIT | 16.7 | 19.5 | 27.7 | 74.3 | 115.6 | 132.1 | 207.9 | 327.4 | 515.4 | 811.5 |
| EBIT, % | 15.06 | 8.77 | 8.52 | 14.61 | 17.87 | 12.97 | 12.97 | 12.97 | 12.97 | 12.97 |
| Total Cash | 39.8 | 28.8 | 41.0 | 115.6 | 100.2 | 203.2 | 319.9 | 503.7 | 793.0 | 1,248.6 |
| Total Cash, percent | .0 | .0 | .0 | .0 | .0 | .0 | .0 | .0 | .0 | .0 |
| Account Receivables | 8.8 | 5.1 | 7.6 | 9.9 | 9.2 | 32.5 | 51.1 | 80.5 | 126.8 | 199.6 |
| Account Receivables, % | 7.93 | 2.31 | 2.33 | 1.95 | 1.42 | 3.19 | 3.19 | 3.19 | 3.19 | 3.19 |
| Inventories | 15.7 | 51.5 | 70.2 | 84.1 | 99.8 | 185.3 | 291.7 | 459.3 | 723.0 | 1,138.4 |
| Inventories, % | 14.21 | 23.12 | 21.64 | 16.53 | 15.43 | 18.19 | 18.19 | 18.19 | 18.19 | 18.19 |
| Accounts Payable | 15.9 | 37.0 | 44.8 | 56.2 | 79.1 | 138.7 | 218.4 | 343.8 | 541.3 | 852.2 |
| Accounts Payable, % | 14.36 | 16.63 | 13.81 | 11.05 | 12.23 | 13.62 | 13.62 | 13.62 | 13.62 | 13.62 |
| Capital Expenditure | -3.3 | -6.7 | -7.8 | -5.6 | -8.0 | -21.8 | -34.4 | -54.1 | -85.2 | -134.2 |
| Capital Expenditure, % | -2.95 | -3.03 | -2.4 | -1.1 | -1.24 | -2.14 | -2.14 | -2.14 | -2.14 | -2.14 |
| Tax Rate, % | 20.65 | 20.65 | 20.65 | 20.65 | 20.65 | 20.65 | 20.65 | 20.65 | 20.65 | 20.65 |
| EBITAT | 12.7 | 14.6 | 20.8 | 55.3 | 91.7 | 100.3 | 157.9 | 248.6 | 391.4 | 616.2 |
| Depreciation | ||||||||||
| Changes in Account Receivables | ||||||||||
| Changes in Inventories | ||||||||||
| Changes in Accounts Payable | ||||||||||
| Capital Expenditure | ||||||||||
| UFCF | 5.0 | .9 | 4.0 | 53.5 | 101.5 | 50.1 | 110.9 | 174.6 | 274.9 | 432.7 |
| WACC, % | 18.54 | 18.54 | 18.54 | 18.54 | 18.55 | 18.54 | 18.54 | 18.54 | 18.54 | 18.54 |
| PV UFCF | ||||||||||
| SUM PV UFCF | 550.0 | |||||||||
| Long Term Growth Rate, % | 4.00 | |||||||||
| Free cash flow (T + 1) | 450 | |||||||||
| Terminal Value | 3,094 | |||||||||
| Present Terminal Value | 1,322 | |||||||||
| Enterprise Value | 1,872 | |||||||||
| Net Debt | -28 | |||||||||
| Equity Value | 1,899 | |||||||||
| Diluted Shares Outstanding, MM | 62 | |||||||||
| Equity Value Per Share | 30.75 |
What You Will Receive
- Genuine Oddity Tech Data: Preloaded financial metrics – from revenue to EBIT – based on actual and forecasted figures.
- Comprehensive Customization: Modify all essential parameters (highlighted cells) such as WACC, growth %, and tax rates.
- Immediate Valuation Adjustments: Automatic recalculations to assess the effects of changes on Oddity Tech Ltd.’s fair value.
- Flexible Excel Template: Designed for quick modifications, scenario analysis, and thorough projections.
- Efficient and Precise: Avoid constructing models from scratch while ensuring accuracy and adaptability.
Key Features
- Real-Time ODD Data: Equipped with Oddity Tech Ltd.'s historical performance metrics and future growth forecasts.
- Completely Adjustable Parameters: Modify revenue growth, profit margins, discount rates, tax considerations, and capital allocation.
- Interactive Valuation Framework: Automatically recalculates Net Present Value (NPV) and intrinsic valuation based on user inputs.
- What-If Analysis: Generate various forecasting scenarios to explore different valuation possibilities.
- Intuitive Interface: Easy to navigate, structured for both industry professionals and newcomers.
How It Works
- Download the Template: Gain immediate access to the Excel-based ODD Discounted Cash Flow (DCF) Calculator.
- Input Your Assumptions: Modify the yellow-highlighted cells for growth rates, WACC, profit margins, and more.
- Instant Calculations: The model will automatically refresh to reveal Oddity Tech Ltd.’s intrinsic value.
- Test Scenarios: Experiment with various assumptions to see how they affect valuation outcomes.
- Analyze and Decide: Leverage the results to inform your investment strategy or financial analysis.
Why Opt for Oddity Tech Ltd. (ODD) Calculator?
- Time-Saving: Skip the hassle of building a DCF model from the ground up – it's ready for immediate use.
- Enhanced Precision: Dependable financial data and formulas minimize valuation errors.
- Completely Customizable: Adjust the model to align with your assumptions and forecasts.
- User-Friendly: Intuitive charts and outputs facilitate straightforward analysis of results.
- Preferred by Professionals: Created for experts who prioritize accuracy and ease of use.
Who Can Benefit from Oddity Tech Ltd. (ODD)?
- Investors: Empower your investment choices with a sophisticated valuation tool designed for clarity and precision.
- Financial Analysts: Streamline your workflow with a customizable DCF model that’s ready to go.
- Consultants: Effortlessly modify the template for impactful client presentations or detailed reports.
- Finance Enthusiasts: Enhance your knowledge of valuation methods through practical, real-world examples.
- Educators and Students: Leverage this tool as a hands-on resource for finance education and training.
Components of the Template
- Pre-Filled Data: Features Oddity Tech Ltd.'s historical financial performance and projections.
- Discounted Cash Flow Model: Editable DCF valuation model that includes automatic calculations.
- Weighted Average Cost of Capital (WACC): A specific sheet designed for calculating WACC using custom inputs.
- Key Financial Ratios: Assess Oddity Tech Ltd.'s profitability, efficiency, and financial leverage.
- Customizable Inputs: Easily modify revenue growth rates, profit margins, and tax rates.
- Clear Dashboard: Visualizations and tables summarizing essential valuation outcomes.
Disclaimer
All information, articles, and product details provided on this website are for general informational and educational purposes only. We do not claim any ownership over, nor do we intend to infringe upon, any trademarks, copyrights, logos, brand names, or other intellectual property mentioned or depicted on this site. Such intellectual property remains the property of its respective owners, and any references here are made solely for identification or informational purposes, without implying any affiliation, endorsement, or partnership.
We make no representations or warranties, express or implied, regarding the accuracy, completeness, or suitability of any content or products presented. Nothing on this website should be construed as legal, tax, investment, financial, medical, or other professional advice. In addition, no part of this site—including articles or product references—constitutes a solicitation, recommendation, endorsement, advertisement, or offer to buy or sell any securities, franchises, or other financial instruments, particularly in jurisdictions where such activity would be unlawful.
All content is of a general nature and may not address the specific circumstances of any individual or entity. It is not a substitute for professional advice or services. Any actions you take based on the information provided here are strictly at your own risk. You accept full responsibility for any decisions or outcomes arising from your use of this website and agree to release us from any liability in connection with your use of, or reliance upon, the content or products found herein.