
|
Oil India Limited (Oil.NS) Avaliação DCF |
Totalmente Editável: Adapte-Se Às Suas Necessidades No Excel Ou Planilhas
Design Profissional: Modelos Confiáveis E Padrão Da Indústria
Pré-Construídos Para Uso Rápido E Eficiente
Compatível com MAC/PC, totalmente desbloqueado
Não É Necessária Experiência; Fácil De Seguir
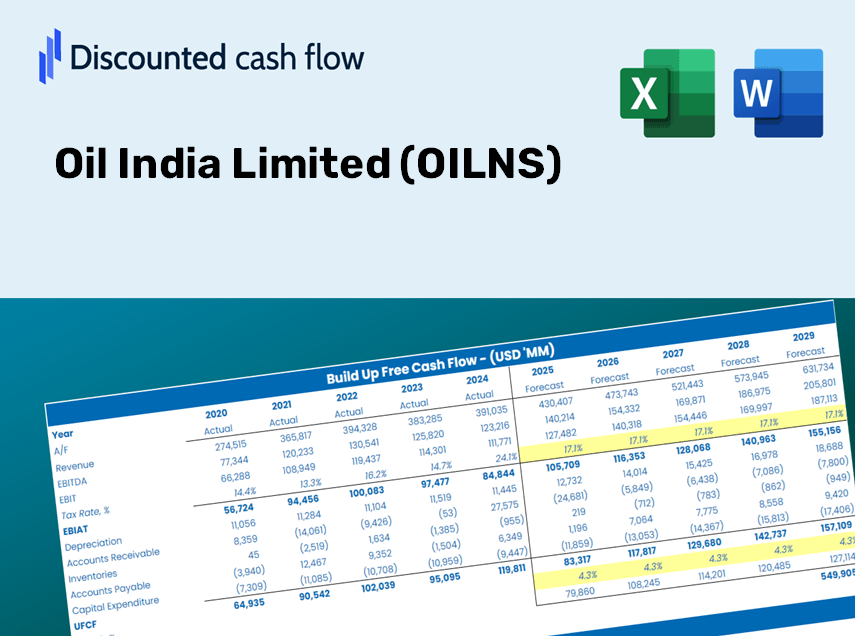
Oil India Limited (OIL.NS) Bundle
Procurando avaliar o valor intrínseco da Oil India Limited? Nossa calculadora Oilns DCF integra dados do mundo real com opções abrangentes de personalização, permitindo que você adapte suas previsões e aprimore suas decisões de investimento.
Discounted Cash Flow (DCF) - (USD MM)
| Year | AY1 2021 |
AY2 2022 |
AY3 2023 |
AY4 2024 |
AY5 2025 |
FY1 2026 |
FY2 2027 |
FY3 2028 |
FY4 2029 |
FY5 2030 |
|---|---|---|---|---|---|---|---|---|---|---|
| Revenue | 226,600.6 | 259,182.2 | 361,091.9 | 324,914.2 | 325,358.0 | 360,997.5 | 400,541.0 | 444,416.0 | 493,097.0 | 547,110.6 |
| Revenue Growth, % | 0 | 14.38 | 39.32 | -10.02 | 0.13659 | 10.95 | 10.95 | 10.95 | 10.95 | 10.95 |
| EBITDA | 65,728.2 | 113,701.4 | 165,283.3 | 131,302.5 | 119,292.4 | 141,312.5 | 156,791.8 | 173,966.7 | 193,022.9 | 214,166.5 |
| EBITDA, % | 29.01 | 43.87 | 45.77 | 40.41 | 36.66 | 39.15 | 39.15 | 39.15 | 39.15 | 39.15 |
| Depreciation | 25,863.8 | 26,068.6 | 24,283.8 | 25,591.5 | 28,513.7 | 32,372.2 | 35,918.2 | 39,852.7 | 44,218.1 | 49,061.7 |
| Depreciation, % | 11.41 | 10.06 | 6.73 | 7.88 | 8.76 | 8.97 | 8.97 | 8.97 | 8.97 | 8.97 |
| EBIT | 39,864.4 | 87,632.8 | 140,999.5 | 105,711.0 | 90,778.7 | 108,940.4 | 120,873.6 | 134,114.0 | 148,804.8 | 165,104.8 |
| EBIT, % | 17.59 | 33.81 | 39.05 | 32.54 | 27.9 | 30.18 | 30.18 | 30.18 | 30.18 | 30.18 |
| Total Cash | 21,572.3 | 21,065.3 | 38,508.9 | 67,956.0 | 78,410.7 | 52,941.7 | 58,741.0 | 65,175.4 | 72,314.7 | 80,236.0 |
| Total Cash, percent | .0 | .0 | .0 | .0 | .0 | .0 | .0 | .0 | .0 | .0 |
| Account Receivables | 22,731.2 | 18,974.6 | 26,603.4 | 33,331.3 | 33,485.2 | 32,684.8 | 36,265.1 | 40,237.5 | 44,645.1 | 49,535.5 |
| Account Receivables, % | 10.03 | 7.32 | 7.37 | 10.26 | 10.29 | 9.05 | 9.05 | 9.05 | 9.05 | 9.05 |
| Inventories | 32,196.5 | 39,108.5 | 51,144.2 | 44,857.2 | 50,440.9 | 52,539.9 | 58,295.1 | 64,680.7 | 71,765.8 | 79,627.0 |
| Inventories, % | 14.21 | 15.09 | 14.16 | 13.81 | 15.5 | 14.55 | 14.55 | 14.55 | 14.55 | 14.55 |
| Accounts Payable | 13,814.1 | 16,929.5 | 18,354.3 | 17,114.0 | 23,055.1 | 21,706.4 | 24,084.1 | 26,722.2 | 29,649.4 | 32,897.1 |
| Accounts Payable, % | 6.1 | 6.53 | 5.08 | 5.27 | 7.09 | 6.01 | 6.01 | 6.01 | 6.01 | 6.01 |
| Capital Expenditure | -31,270.5 | -59,679.9 | -85,245.5 | -120,628.3 | -129,689.9 | -99,217.0 | -110,085.2 | -122,143.9 | -135,523.4 | -150,368.6 |
| Capital Expenditure, % | -13.8 | -23.03 | -23.61 | -37.13 | -39.86 | -27.48 | -27.48 | -27.48 | -27.48 | -27.48 |
| Tax Rate, % | 30.58 | 30.58 | 30.58 | 30.58 | 30.58 | 30.58 | 30.58 | 30.58 | 30.58 | 30.58 |
| EBITAT | 32,192.0 | 54,797.2 | 93,635.0 | 75,706.1 | 63,020.1 | 76,417.3 | 84,788.0 | 94,075.7 | 104,380.6 | 115,814.4 |
| Depreciation | ||||||||||
| Changes in Account Receivables | ||||||||||
| Changes in Inventories | ||||||||||
| Changes in Accounts Payable | ||||||||||
| Capital Expenditure | ||||||||||
| UFCF | -14,328.3 | 21,145.9 | 14,433.6 | -21,011.9 | -37,952.6 | 6,925.1 | 3,663.3 | 4,064.6 | 4,509.8 | 5,003.8 |
| WACC, % | 4.38 | 4.17 | 4.22 | 4.28 | 4.25 | 4.26 | 4.26 | 4.26 | 4.26 | 4.26 |
| PV UFCF | ||||||||||
| SUM PV UFCF | 21,476.9 | |||||||||
| Long Term Growth Rate, % | 0.50 | |||||||||
| Free cash flow (T + 1) | 5,029 | |||||||||
| Terminal Value | 133,740 | |||||||||
| Present Terminal Value | 108,560 | |||||||||
| Enterprise Value | 130,037 | |||||||||
| Net Debt | 234,481 | |||||||||
| Equity Value | -104,444 | |||||||||
| Diluted Shares Outstanding, MM | 1,627 | |||||||||
| Equity Value Per Share | -64.20 |
What You Will Receive
- Authentic OILNS Financials: Access comprehensive historical and projected data for precise valuations.
- Customizable Inputs: Adjust parameters such as WACC, tax rates, revenue growth, and capital expenditures.
- Automated Calculations: Dynamic computation of intrinsic value and NPV for real-time insights.
- Scenario Analysis: Evaluate multiple scenarios to assess Oil India Limited's future performance.
- User-Friendly and Intuitive Design: Crafted for industry experts while remaining approachable for novices.
Key Features
- Customizable Projection Inputs: Adjust essential metrics such as production growth, operating margins, and capital investments.
- Instant DCF Valuation: Quickly computes intrinsic value, net present value (NPV), and additional financial metrics.
- High-Precision Accuracy: Utilizes real data from Oil India Limited (OILNS) for reliable valuation outcomes.
- Simplified Scenario Analysis: Effortlessly explore various assumptions and analyze results side-by-side.
- Efficiency Boost: Remove the hassle of constructing intricate valuation models from the ground up.
How It Functions
- 1. Access the Template: Download and open the Excel file containing Oil India Limited’s (OILNS) preloaded data.
- 2. Adjust Parameters: Modify essential inputs such as growth rates, WACC, and capital expenditures.
- 3. See Results in Real-Time: The DCF model automatically computes intrinsic value and NPV.
- 4. Explore Scenarios: Evaluate various forecasts to assess different valuation scenarios.
- 5. Present with Assurance: Deliver professional valuation insights to reinforce your decision-making.
Why Opt for the OILNS Calculator?
- Precision: Utilizes accurate financial data from Oil India Limited for reliable results.
- Versatility: Crafted to allow users to effortlessly adjust and experiment with inputs.
- Efficiency: Eliminate the complexity of constructing a DCF model from the ground up.
- CFO-Level Quality: Engineered with the expertise and usability of top-tier financial professionals.
- Accessible: Simple and intuitive interface, suitable for users without extensive financial modeling skills.
Who Can Benefit from This Product?
- Finance Students: Master valuation methods and apply your knowledge using real-world data.
- Academics: Integrate industry-standard models into your research and teaching materials.
- Investors: Validate your investment hypotheses and assess valuation results for Oil India Limited (OILNS).
- Analysts: Enhance your efficiency with a user-friendly, customizable DCF model.
- Small Business Owners: Understand how large publicly traded companies like Oil India Limited (OILNS) are evaluated.
Contents of the Template
- Pre-Filled DCF Model: Oil India Limited’s financial data preloaded for immediate application.
- WACC Calculator: Comprehensive calculations for Weighted Average Cost of Capital.
- Financial Ratios: Assess Oil India Limited’s profitability, leverage, and operational efficiency.
- Editable Inputs: Modify assumptions such as growth rates, profit margins, and capital expenditures to tailor your analysis.
- Financial Statements: Access annual and quarterly reports for in-depth evaluation.
- Interactive Dashboard: Effortlessly visualize key valuation metrics and outcomes.
Disclaimer
All information, articles, and product details provided on this website are for general informational and educational purposes only. We do not claim any ownership over, nor do we intend to infringe upon, any trademarks, copyrights, logos, brand names, or other intellectual property mentioned or depicted on this site. Such intellectual property remains the property of its respective owners, and any references here are made solely for identification or informational purposes, without implying any affiliation, endorsement, or partnership.
We make no representations or warranties, express or implied, regarding the accuracy, completeness, or suitability of any content or products presented. Nothing on this website should be construed as legal, tax, investment, financial, medical, or other professional advice. In addition, no part of this site—including articles or product references—constitutes a solicitation, recommendation, endorsement, advertisement, or offer to buy or sell any securities, franchises, or other financial instruments, particularly in jurisdictions where such activity would be unlawful.
All content is of a general nature and may not address the specific circumstances of any individual or entity. It is not a substitute for professional advice or services. Any actions you take based on the information provided here are strictly at your own risk. You accept full responsibility for any decisions or outcomes arising from your use of this website and agree to release us from any liability in connection with your use of, or reliance upon, the content or products found herein.