
|
A avaliação DCF do Grupo OLB, Inc. (OLB) |
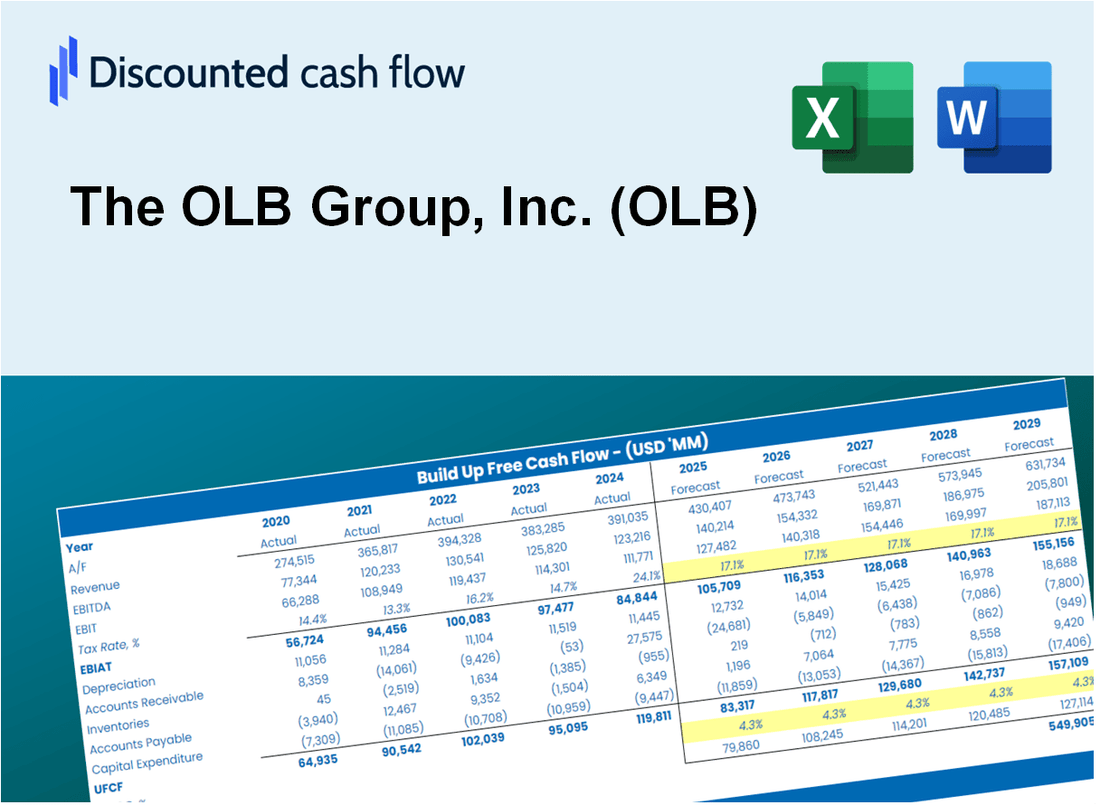
Totalmente Editável: Adapte-Se Às Suas Necessidades No Excel Ou Planilhas
Design Profissional: Modelos Confiáveis E Padrão Da Indústria
Pré-Construídos Para Uso Rápido E Eficiente
Compatível com MAC/PC, totalmente desbloqueado
Não É Necessária Experiência; Fácil De Seguir
The OLB Group, Inc. (OLB) Bundle
Explore o potencial financeiro da OLB Group, Inc. (OLB) com nossa calculadora DCF amigável! Basta inserir suas suposições para taxas de crescimento, margens de lucro e despesas para calcular o valor intrínseco da OLB Group, Inc. (OLB) e aprimorar sua abordagem de investimento.
What You Will Get
- Editable Forecast Inputs: Effortlessly adjust key assumptions (growth %, margins, WACC) to explore various scenarios.
- Real-World Data: The OLB Group, Inc.'s (OLB) financial data pre-loaded to facilitate your analysis.
- Automatic DCF Outputs: The template computes Net Present Value (NPV) and intrinsic value automatically.
- Customizable and Professional: A sleek Excel model that aligns with your valuation requirements.
- Built for Analysts and Investors: Perfect for evaluating projections, confirming strategies, and enhancing efficiency.
Key Features
- Real-Time OLB Data: Pre-loaded with The OLB Group, Inc.'s historical financial performance and future projections.
- Customizable Assumptions: Modify revenue growth rates, profit margins, discount rates, tax implications, and capital investments.
- Interactive Valuation Framework: Automatically refreshes Net Present Value (NPV) and intrinsic value based on user-defined parameters.
- Scenario Analysis: Develop various forecasting scenarios to evaluate different valuation possibilities.
- Intuitive Interface: Designed for ease of use, catering to both seasoned professionals and newcomers.
How It Works
- Download the Template: Gain immediate access to the Excel-based OLB DCF Calculator.
- Input Your Assumptions: Modify the yellow-highlighted cells for growth rates, WACC, margins, and other parameters.
- Instant Calculations: The model automatically recalculates The OLB Group’s intrinsic value.
- Test Scenarios: Experiment with various assumptions to assess potential changes in valuation.
- Analyze and Decide: Leverage the results to inform your investment or financial analysis.
Why Choose The OLB Group, Inc. (OLB)?
- Streamlined Solutions: Access comprehensive financial services without the hassle of extensive setup.
- Enhanced Accuracy: Our robust data analytics minimize discrepancies in financial assessments.
- Completely Adaptable: Modify our offerings to align with your unique business needs and forecasts.
- User-Friendly Interface: Intuitive designs and visualizations simplify data interpretation.
- Preferred by Industry Leaders: Our solutions are crafted for those who prioritize effectiveness and precision.
Who Should Use This Product?
- Professional Investors: Develop comprehensive and accurate valuation models for assessing OLB's performance.
- Corporate Finance Teams: Evaluate valuation scenarios to inform strategic decisions within the organization.
- Consultants and Advisors: Deliver precise valuation insights to clients interested in OLB (OLB).
- Students and Educators: Utilize real-world data to enhance learning and practice in financial modeling.
- Tech Enthusiasts: Gain insights into the valuation processes of tech companies like OLB (OLB) in the current market.
What the Template Contains
- Comprehensive DCF Model: Editable template featuring detailed valuation calculations for The OLB Group, Inc. (OLB).
- Real-World Data: The OLB Group's historical and projected financials preloaded for thorough analysis.
- Customizable Parameters: Adjust WACC, growth rates, and tax assumptions to explore various scenarios.
- Financial Statements: Complete annual and quarterly breakdowns to provide deeper insights.
- Key Ratios: Integrated analysis for profitability, efficiency, and leverage metrics.
- Dashboard with Visual Outputs: Visualizations including charts and tables for clear, actionable results.
Disclaimer
All information, articles, and product details provided on this website are for general informational and educational purposes only. We do not claim any ownership over, nor do we intend to infringe upon, any trademarks, copyrights, logos, brand names, or other intellectual property mentioned or depicted on this site. Such intellectual property remains the property of its respective owners, and any references here are made solely for identification or informational purposes, without implying any affiliation, endorsement, or partnership.
We make no representations or warranties, express or implied, regarding the accuracy, completeness, or suitability of any content or products presented. Nothing on this website should be construed as legal, tax, investment, financial, medical, or other professional advice. In addition, no part of this site—including articles or product references—constitutes a solicitation, recommendation, endorsement, advertisement, or offer to buy or sell any securities, franchises, or other financial instruments, particularly in jurisdictions where such activity would be unlawful.
All content is of a general nature and may not address the specific circumstances of any individual or entity. It is not a substitute for professional advice or services. Any actions you take based on the information provided here are strictly at your own risk. You accept full responsibility for any decisions or outcomes arising from your use of this website and agree to release us from any liability in connection with your use of, or reliance upon, the content or products found herein.