
|
Omnicom Group Inc. (OMC) Avaliação DCF |
Totalmente Editável: Adapte-Se Às Suas Necessidades No Excel Ou Planilhas
Design Profissional: Modelos Confiáveis E Padrão Da Indústria
Pré-Construídos Para Uso Rápido E Eficiente
Compatível com MAC/PC, totalmente desbloqueado
Não É Necessária Experiência; Fácil De Seguir
Omnicom Group Inc. (OMC) Bundle
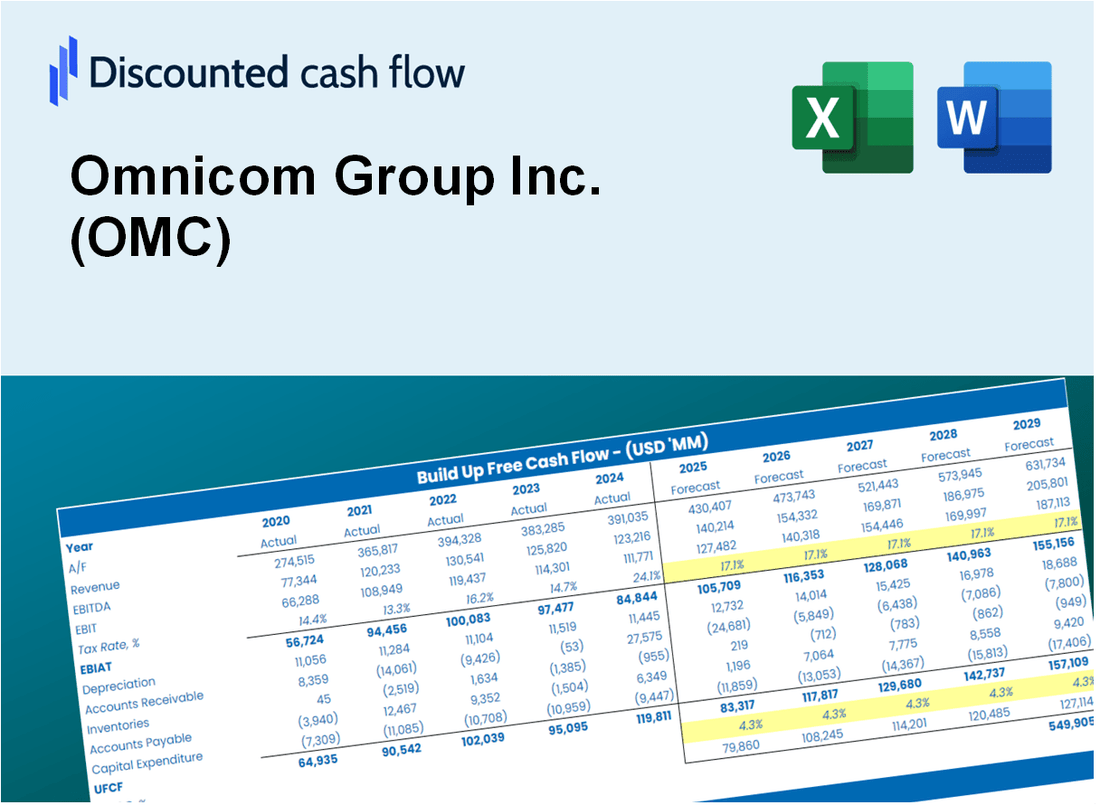
Descubra o verdadeiro valor do Omnicom Group Inc. (OMC) com nossa calculadora DCF avançada! Ajuste as principais suposições, explore vários cenários e avalie como as mudanças afetam a avaliação do Omnicom Group Inc. (OMC) - tudo dentro de um único modelo do Excel.
Discounted Cash Flow (DCF) - (USD MM)
| Year | AY1 2020 |
AY2 2021 |
AY3 2022 |
AY4 2023 |
AY5 2024 |
FY1 2025 |
FY2 2026 |
FY3 2027 |
FY4 2028 |
FY5 2029 |
|---|---|---|---|---|---|---|---|---|---|---|
| Revenue | 13,171.1 | 14,289.4 | 14,289.1 | 14,692.2 | 15,689.1 | 16,398.8 | 17,140.7 | 17,916.0 | 18,726.5 | 19,573.6 |
| Revenue Growth, % | 0 | 8.49 | -0.00209946 | 2.82 | 6.79 | 4.52 | 4.52 | 4.52 | 4.52 | 4.52 |
| EBITDA | 1,846.0 | 2,410.7 | 2,373.4 | 2,422.5 | 2,617.2 | 2,645.7 | 2,765.3 | 2,890.4 | 3,021.2 | 3,157.9 |
| EBITDA, % | 14.02 | 16.87 | 16.61 | 16.49 | 16.68 | 16.13 | 16.13 | 16.13 | 16.13 | 16.13 |
| Depreciation | 222.6 | 212.1 | 219.4 | 211.1 | 241.7 | 252.1 | 263.5 | 275.4 | 287.9 | 300.9 |
| Depreciation, % | 1.69 | 1.48 | 1.54 | 1.44 | 1.54 | 1.54 | 1.54 | 1.54 | 1.54 | 1.54 |
| EBIT | 1,623.4 | 2,198.6 | 2,154.0 | 2,211.4 | 2,375.5 | 2,393.5 | 2,501.8 | 2,615.0 | 2,733.3 | 2,856.9 |
| EBIT, % | 12.33 | 15.39 | 15.07 | 15.05 | 15.14 | 14.6 | 14.6 | 14.6 | 14.6 | 14.6 |
| Total Cash | 5,600.5 | 5,316.8 | 4,342.5 | 4,432.0 | 4,339.4 | 5,508.2 | 5,757.3 | 6,017.8 | 6,290.0 | 6,574.5 |
| Total Cash, percent | .0 | .0 | .0 | .0 | .0 | .0 | .0 | .0 | .0 | .0 |
| Account Receivables | 7,813.4 | 8,472.5 | 8,097.1 | 8,659.8 | 9,242.0 | 9,614.0 | 10,048.9 | 10,503.4 | 10,978.6 | 11,475.2 |
| Account Receivables, % | 59.32 | 59.29 | 56.67 | 58.94 | 58.91 | 58.63 | 58.63 | 58.63 | 58.63 | 58.63 |
| Inventories | 1,101.2 | 1,201.0 | 1,254.6 | 1,342.5 | 1,622.2 | 1,476.6 | 1,543.4 | 1,613.3 | 1,686.2 | 1,762.5 |
| Inventories, % | 8.36 | 8.4 | 8.78 | 9.14 | 10.34 | 9 | 9 | 9 | 9 | 9 |
| Accounts Payable | 11,513.0 | 11,897.2 | 11,000.2 | 11,634.0 | 12,484.4 | 13,329.3 | 13,932.3 | 14,562.6 | 15,221.3 | 15,909.9 |
| Accounts Payable, % | 87.41 | 83.26 | 76.98 | 79.18 | 79.57 | 81.28 | 81.28 | 81.28 | 81.28 | 81.28 |
| Capital Expenditure | -75.4 | -665.8 | -78.2 | -78.4 | -140.6 | -236.4 | -247.1 | -258.3 | -270.0 | -282.2 |
| Capital Expenditure, % | -0.57247 | -4.66 | -0.54727 | -0.53362 | -0.89616 | -1.44 | -1.44 | -1.44 | -1.44 | -1.44 |
| Tax Rate, % | 30.63 | 30.63 | 30.63 | 30.63 | 30.63 | 30.63 | 30.63 | 30.63 | 30.63 | 30.63 |
| EBITAT | 1,101.0 | 1,537.0 | 1,434.9 | 1,539.9 | 1,647.8 | 1,643.6 | 1,718.0 | 1,795.7 | 1,876.9 | 1,961.8 |
| Depreciation | ||||||||||
| Changes in Account Receivables | ||||||||||
| Changes in Inventories | ||||||||||
| Changes in Accounts Payable | ||||||||||
| Capital Expenditure | ||||||||||
| UFCF | 3,846.6 | 708.6 | 1,000.9 | 1,655.8 | 1,737.4 | 2,277.9 | 1,835.6 | 1,918.7 | 2,005.5 | 2,096.2 |
| WACC, % | 5.77 | 5.79 | 5.75 | 5.79 | 5.78 | 5.78 | 5.78 | 5.78 | 5.78 | 5.78 |
| PV UFCF | ||||||||||
| SUM PV UFCF | 8,600.3 | |||||||||
| Long Term Growth Rate, % | 1.00 | |||||||||
| Free cash flow (T + 1) | 2,117 | |||||||||
| Terminal Value | 44,325 | |||||||||
| Present Terminal Value | 33,474 | |||||||||
| Enterprise Value | 42,074 | |||||||||
| Net Debt | 2,531 | |||||||||
| Equity Value | 39,543 | |||||||||
| Diluted Shares Outstanding, MM | 199 | |||||||||
| Equity Value Per Share | 199.11 |
What You Will Receive
- Adjustable Forecast Variables: Seamlessly modify assumptions (growth %, margins, WACC) to explore various scenarios.
- Real-World Financials: Omnicom Group Inc. (OMC) financial data pre-loaded to enhance your analysis.
- Automated DCF Calculations: The template computes Net Present Value (NPV) and intrinsic value automatically.
- Tailored and Professional Design: A refined Excel model that aligns with your valuation requirements.
- Designed for Analysts and Investors: Perfect for evaluating forecasts, confirming strategies, and optimizing efficiency.
Key Features
- Pre-Loaded Data: Omnicom Group Inc.'s historical financial statements and pre-filled forecasts.
- Fully Adjustable Inputs: Modify WACC, tax rates, revenue growth, and EBITDA margins as needed.
- Instant Results: View Omnicom Group Inc.'s intrinsic value recalculating in real time.
- Clear Visual Outputs: Dashboard charts present valuation results and essential metrics.
- Built for Accuracy: A professional tool designed for analysts, investors, and finance experts.
How It Works
- 1. Access the Template: Download and open the Excel file featuring Omnicom Group Inc.'s (OMC) preloaded financial data.
- 2. Adjust Key Variables: Modify essential inputs such as revenue growth rates, WACC, and capital expenditures.
- 3. Analyze Results Immediately: The DCF model automatically computes intrinsic value and NPV in real-time.
- 4. Explore Different Scenarios: Evaluate multiple forecasts to assess various valuation possibilities.
- 5. Present with Assurance: Deliver expert valuation insights to enhance your decision-making process.
Why Choose This Calculator?
- Accurate Data: Real Omnicom Group Inc. (OMC) financials ensure reliable valuation results.
- Customizable: Adjust key parameters like growth rates, WACC, and tax rates to align with your projections.
- Time-Saving: Pre-built calculations streamline the process, eliminating the need to start from scratch.
- Professional-Grade Tool: Tailored for investors, analysts, and consultants in the advertising industry.
- User-Friendly: Intuitive design and step-by-step guidance make it accessible for all users.
Who Should Use Omnicom Group Inc. (OMC)?
- Investors: Make informed investment choices with a leading advertising and marketing services firm.
- Marketing Professionals: Gain insights into industry trends and best practices for client campaigns.
- Consultants: Leverage comprehensive data for strategic recommendations and presentations.
- Business Analysts: Analyze market performance and competitive positioning effectively.
- Students and Educators: Utilize as a case study for real-world applications in marketing and business courses.
What the Template Contains
- Pre-Filled DCF Model: Omnicom Group Inc.’s (OMC) financial data preloaded for immediate use.
- WACC Calculator: Detailed calculations for Weighted Average Cost of Capital.
- Financial Ratios: Evaluate Omnicom Group Inc.’s (OMC) profitability, leverage, and efficiency.
- Editable Inputs: Change assumptions such as growth, margins, and CAPEX to fit your scenarios.
- Financial Statements: Annual and quarterly reports to support detailed analysis.
- Interactive Dashboard: Easily visualize key valuation metrics and results.
Disclaimer
All information, articles, and product details provided on this website are for general informational and educational purposes only. We do not claim any ownership over, nor do we intend to infringe upon, any trademarks, copyrights, logos, brand names, or other intellectual property mentioned or depicted on this site. Such intellectual property remains the property of its respective owners, and any references here are made solely for identification or informational purposes, without implying any affiliation, endorsement, or partnership.
We make no representations or warranties, express or implied, regarding the accuracy, completeness, or suitability of any content or products presented. Nothing on this website should be construed as legal, tax, investment, financial, medical, or other professional advice. In addition, no part of this site—including articles or product references—constitutes a solicitation, recommendation, endorsement, advertisement, or offer to buy or sell any securities, franchises, or other financial instruments, particularly in jurisdictions where such activity would be unlawful.
All content is of a general nature and may not address the specific circumstances of any individual or entity. It is not a substitute for professional advice or services. Any actions you take based on the information provided here are strictly at your own risk. You accept full responsibility for any decisions or outcomes arising from your use of this website and agree to release us from any liability in connection with your use of, or reliance upon, the content or products found herein.