
|
Avaliação DCF da Omeros Corporation (OMER) |
Totalmente Editável: Adapte-Se Às Suas Necessidades No Excel Ou Planilhas
Design Profissional: Modelos Confiáveis E Padrão Da Indústria
Pré-Construídos Para Uso Rápido E Eficiente
Compatível com MAC/PC, totalmente desbloqueado
Não É Necessária Experiência; Fácil De Seguir
Omeros Corporation (OMER) Bundle
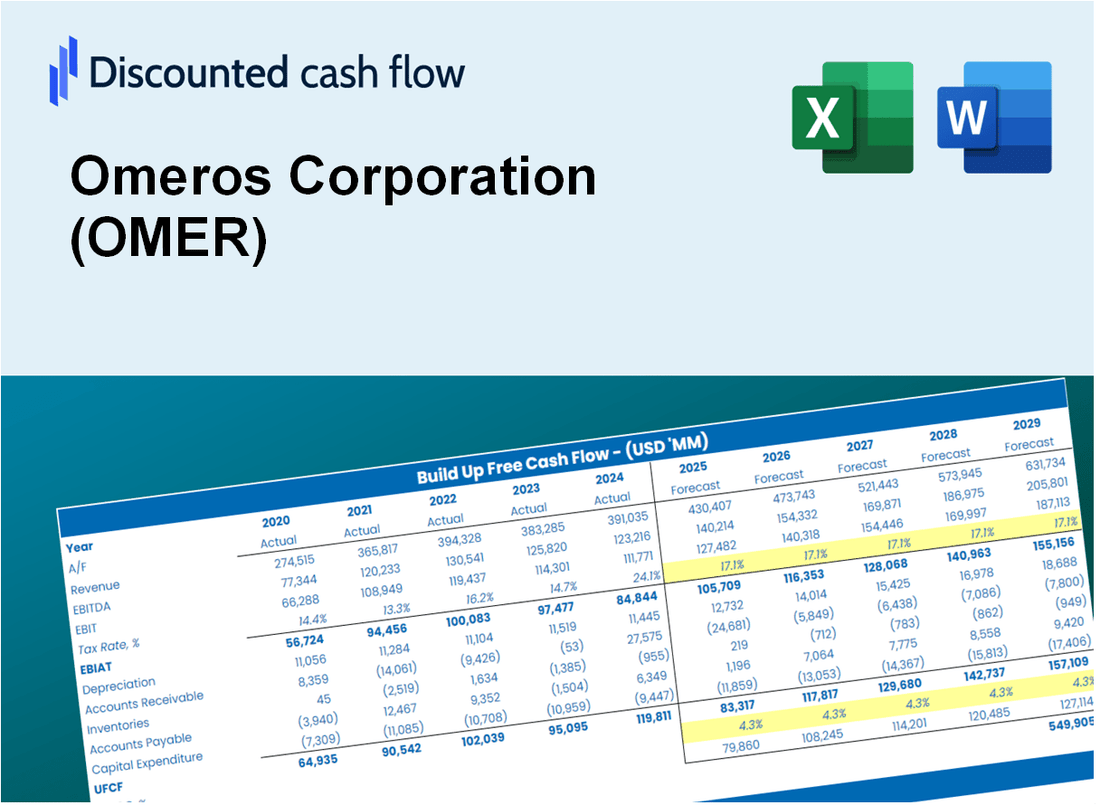
Projetado para precisão, nossa calculadora DCF da Omeros Corporation (Omer) permite avaliar a avaliação da Omeros Corporation usando dados financeiros do mundo real, oferecendo flexibilidade completa para modificar todos os parâmetros essenciais para projeções aprimoradas.
Discounted Cash Flow (DCF) - (USD MM)
| Year | AY1 2020 |
AY2 2021 |
AY3 2022 |
AY4 2023 |
AY5 2024 |
FY1 2025 |
FY2 2026 |
FY3 2027 |
FY4 2028 |
FY5 2029 |
|---|---|---|---|---|---|---|---|---|---|---|
| Revenue | 73.8 | .0 | .0 | .0 | .0 | .0 | .0 | .0 | .0 | .0 |
| Revenue Growth, % | 0 | -100 | 0 | 0 | 0 | -25 | -25 | -25 | -25 | -25 |
| EBITDA | -168.0 | -170.5 | -158.4 | -143.2 | -157.0 | .0 | .0 | .0 | .0 | .0 |
| EBITDA, % | -227.63 | 100 | 100 | 100 | 100 | 60 | 60 | 60 | 60 | 60 |
| Depreciation | 1.6 | 1.4 | 1.0 | .9 | 1.0 | .0 | .0 | .0 | .0 | .0 |
| Depreciation, % | 2.19 | 100 | 100 | 100 | 100 | 80.44 | 80.44 | 80.44 | 80.44 | 80.44 |
| EBIT | -169.6 | -171.9 | -159.3 | -144.1 | -158.0 | .0 | .0 | .0 | .0 | .0 |
| EBIT, % | -229.82 | 100 | 100 | 100 | 100 | 60 | 60 | 60 | 60 | 60 |
| Total Cash | 135.0 | 157.3 | 194.9 | 171.8 | 90.1 | .0 | .0 | .0 | .0 | .0 |
| Total Cash, percent | .0 | .0 | .0 | .0 | .0 | .0 | .0 | .0 | .0 | .0 |
| Account Receivables | 3.8 | 82.5 | 242.0 | 6.7 | 36.8 | .0 | .0 | .0 | .0 | .0 |
| Account Receivables, % | 5.2 | 100 | 100 | 100 | 100 | 81.04 | 81.04 | 81.04 | 81.04 | 81.04 |
| Inventories | 1.4 | .0 | .0 | .0 | .0 | .0 | .0 | .0 | .0 | .0 |
| Inventories, % | 1.84 | 100 | 100 | 100 | 100 | 80.37 | 80.37 | 80.37 | 80.37 | 80.37 |
| Accounts Payable | 4.2 | 13.4 | 6.0 | 7.7 | 5.9 | .0 | .0 | .0 | .0 | .0 |
| Accounts Payable, % | 5.69 | 100 | 100 | 100 | 100 | 81.14 | 81.14 | 81.14 | 81.14 | 81.14 |
| Capital Expenditure | -.3 | -.3 | -.1 | -.4 | -.2 | .0 | .0 | .0 | .0 | .0 |
| Capital Expenditure, % | -0.3834 | 100 | 100 | 100 | 100 | -0.07668026 | -0.07668026 | -0.07668026 | -0.07668026 | -0.07668026 |
| Tax Rate, % | 14.13 | 14.13 | 14.13 | 14.13 | 14.13 | 14.13 | 14.13 | 14.13 | 14.13 | 14.13 |
| EBITAT | -126.5 | 174.3 | 41.5 | -97.0 | -135.6 | .0 | .0 | .0 | .0 | .0 |
| Depreciation | ||||||||||
| Changes in Account Receivables | ||||||||||
| Changes in Inventories | ||||||||||
| Changes in Accounts Payable | ||||||||||
| Capital Expenditure | ||||||||||
| UFCF | -126.2 | 107.3 | -124.6 | 140.5 | -166.7 | 30.9 | .0 | .0 | .0 | .0 |
| WACC, % | 13.52 | 10.75 | 10.75 | 13.25 | 13.94 | 12.44 | 12.44 | 12.44 | 12.44 | 12.44 |
| PV UFCF | ||||||||||
| SUM PV UFCF | 27.5 | |||||||||
| Long Term Growth Rate, % | 2.00 | |||||||||
| Free cash flow (T + 1) | 0 | |||||||||
| Terminal Value | 0 | |||||||||
| Present Terminal Value | 0 | |||||||||
| Enterprise Value | 27 | |||||||||
| Net Debt | 204 | |||||||||
| Equity Value | -176 | |||||||||
| Diluted Shares Outstanding, MM | 58 | |||||||||
| Equity Value Per Share | -3.03 |
What You Will Get
- Editable Forecast Inputs: Easily modify assumptions (growth %, margins, WACC) to explore various scenarios.
- Real-World Data: Omeros Corporation’s (OMER) financial data pre-filled to kickstart your analysis.
- Automatic DCF Outputs: The template computes Net Present Value (NPV) and intrinsic value automatically.
- Customizable and Professional: A sleek Excel model that can be tailored to fit your valuation requirements.
- Built for Analysts and Investors: Perfect for evaluating projections, confirming strategies, and enhancing efficiency.
Key Features
- Comprehensive Financial Data: Omeros Corporation's historical financial statements and pre-filled projections.
- Customizable Inputs: Adjust WACC, tax rates, revenue growth, and EBITDA margins as needed.
- Real-Time Calculations: Monitor Omeros Corporation's intrinsic value updates instantly.
- Intuitive Visual Outputs: Dashboard charts showcase valuation results and essential metrics.
- Designed for Precision: A professional-grade tool for analysts, investors, and finance professionals.
How It Works
- Step 1: Download the prebuilt Excel template featuring Omeros Corporation’s (OMER) data.
- Step 2: Navigate through the pre-filled sheets to familiarize yourself with the essential metrics.
- Step 3: Modify forecasts and assumptions in the editable yellow cells (WACC, growth, margins).
- Step 4: Instantly see the recalculated results, including Omeros Corporation’s intrinsic value.
- Step 5: Utilize the outputs to make informed investment decisions or generate comprehensive reports.
Why Choose This Calculator for Omeros Corporation (OMER)?
- Accurate Data: Up-to-date Omeros financials provide dependable valuation outcomes.
- Customizable: Tailor essential factors like growth rates, WACC, and tax rates to align with your forecasts.
- Time-Saving: Built-in calculations remove the hassle of starting from the ground up.
- Professional-Grade Tool: Crafted for investors, analysts, and consultants in the biotech sector.
- User-Friendly: Simple design and guided instructions make it accessible for all users.
Who Should Use Omeros Corporation (OMER)?
- Investors: Gain insights and make informed decisions with our comprehensive analysis tools.
- Pharmaceutical Analysts: Streamline your research with our detailed reports on drug development and market potential.
- Healthcare Consultants: Easily customize our data for client presentations or strategic recommendations.
- Biotech Enthusiasts: Enhance your knowledge of the biotech sector through in-depth case studies and examples.
- Educators and Students: Utilize our resources as a hands-on learning tool in life sciences and finance courses.
What the Template Contains
- Operating and Balance Sheet Data: Pre-filled Omeros Corporation (OMER) historical data and forecasts, including revenue, EBITDA, EBIT, and capital expenditures.
- WACC Calculation: A dedicated sheet for Weighted Average Cost of Capital (WACC), including parameters like Beta, risk-free rate, and share price.
- DCF Valuation (Unlevered and Levered): Editable Discounted Cash Flow models showing intrinsic value with detailed calculations.
- Financial Statements: Pre-loaded financial statements (annual and quarterly) to support analysis.
- Key Ratios: Includes profitability, leverage, and efficiency ratios for Omeros Corporation (OMER).
- Dashboard and Charts: Visual summary of valuation outputs and assumptions to analyze results easily.
Disclaimer
All information, articles, and product details provided on this website are for general informational and educational purposes only. We do not claim any ownership over, nor do we intend to infringe upon, any trademarks, copyrights, logos, brand names, or other intellectual property mentioned or depicted on this site. Such intellectual property remains the property of its respective owners, and any references here are made solely for identification or informational purposes, without implying any affiliation, endorsement, or partnership.
We make no representations or warranties, express or implied, regarding the accuracy, completeness, or suitability of any content or products presented. Nothing on this website should be construed as legal, tax, investment, financial, medical, or other professional advice. In addition, no part of this site—including articles or product references—constitutes a solicitation, recommendation, endorsement, advertisement, or offer to buy or sell any securities, franchises, or other financial instruments, particularly in jurisdictions where such activity would be unlawful.
All content is of a general nature and may not address the specific circumstances of any individual or entity. It is not a substitute for professional advice or services. Any actions you take based on the information provided here are strictly at your own risk. You accept full responsibility for any decisions or outcomes arising from your use of this website and agree to release us from any liability in connection with your use of, or reliance upon, the content or products found herein.