
|
Singular Genomics Systems, Inc. (OMIC) Avaliação DCF |
Totalmente Editável: Adapte-Se Às Suas Necessidades No Excel Ou Planilhas
Design Profissional: Modelos Confiáveis E Padrão Da Indústria
Pré-Construídos Para Uso Rápido E Eficiente
Compatível com MAC/PC, totalmente desbloqueado
Não É Necessária Experiência; Fácil De Seguir
Singular Genomics Systems, Inc. (OMIC) Bundle
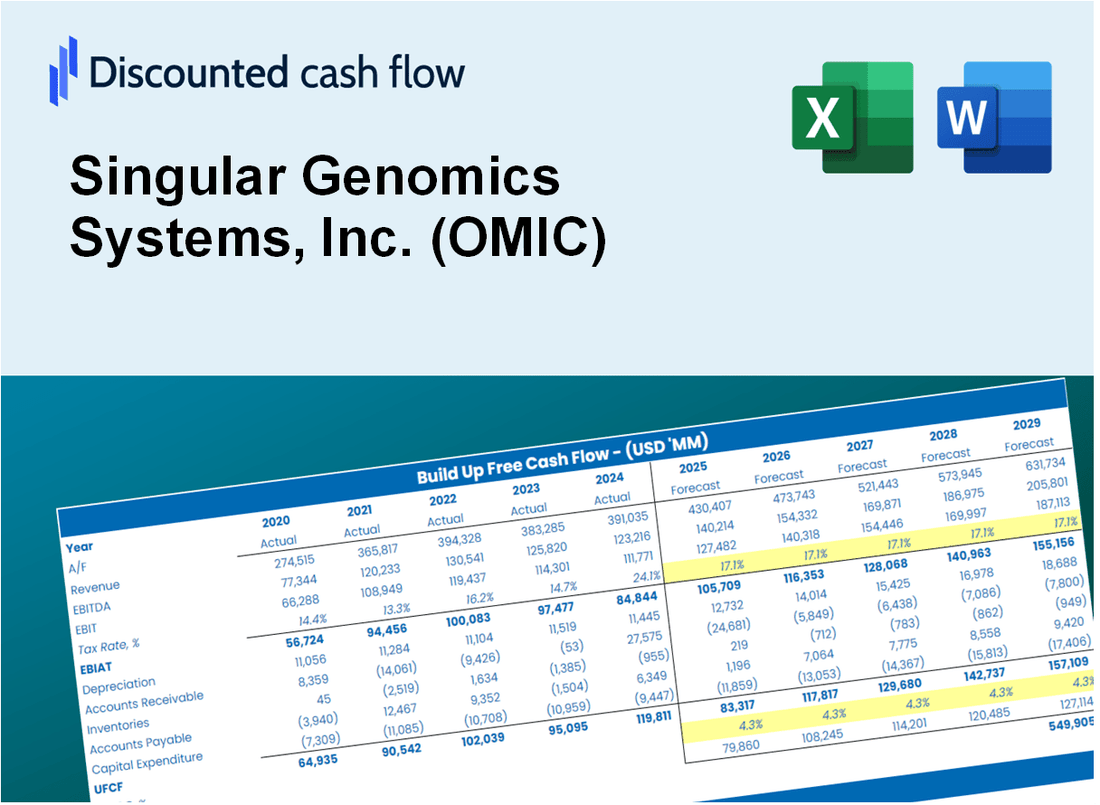
Projetado para precisão, nossa calculadora DCF (OMIC) permite avaliar a avaliação Singular Genomics Systems, Inc. usando dados financeiros atualizados, fornecendo flexibilidade abrangente para modificar todos os parâmetros-chave para melhorar as projeções.
Discounted Cash Flow (DCF) - (USD MM)
| Year | AY1 2019 |
AY2 2020 |
AY3 2021 |
AY4 2022 |
AY5 2023 |
FY1 2024 |
FY2 2025 |
FY3 2026 |
FY4 2027 |
FY5 2028 |
|---|---|---|---|---|---|---|---|---|---|---|
| Revenue | .0 | .0 | .0 | .8 | 2.9 | 3.6 | 4.5 | 5.7 | 7.1 | 8.9 |
| Revenue Growth, % | 0 | 0 | 0 | 0 | 280.52 | 25 | 25 | 25 | 25 | 25 |
| EBITDA | -12.0 | -26.4 | -60.5 | -84.1 | -86.5 | .7 | .9 | 1.1 | 1.4 | 1.8 |
| EBITDA, % | 100 | 100 | 100 | -10991.37 | -2971.35 | 20 | 20 | 20 | 20 | 20 |
| Depreciation | .4 | .6 | 1.1 | 6.0 | 7.2 | 3.6 | 4.5 | 5.7 | 7.1 | 8.9 |
| Depreciation, % | 100 | 100 | 100 | 788.5 | 248.13 | 100 | 100 | 100 | 100 | 100 |
| EBIT | -12.3 | -27.0 | -61.7 | -90.1 | -93.7 | .7 | .9 | 1.1 | 1.4 | 1.8 |
| EBIT, % | 100 | 100 | 100 | -11779.87 | -3219.48 | 20 | 20 | 20 | 20 | 20 |
| Total Cash | 46.2 | 26.9 | 339.2 | 244.6 | 173.9 | 3.6 | 4.5 | 5.7 | 7.1 | 8.9 |
| Total Cash, percent | .0 | .0 | .0 | .0 | .0 | .0 | .0 | .0 | .0 | .0 |
| Account Receivables | .0 | .0 | 1.1 | 2.0 | 1.6 | 3.3 | 4.1 | 5.2 | 6.5 | 8.1 |
| Account Receivables, % | 100 | 100 | 100 | 263.01 | 54.41 | 90.88 | 90.88 | 90.88 | 90.88 | 90.88 |
| Inventories | .0 | .0 | 3.0 | 18.2 | 13.6 | 3.6 | 4.5 | 5.7 | 7.1 | 8.9 |
| Inventories, % | 100 | 100 | 100 | 2381.83 | 466.23 | 100 | 100 | 100 | 100 | 100 |
| Accounts Payable | .6 | .4 | 2.3 | 3.1 | 2.6 | 3.6 | 4.4 | 5.6 | 6.9 | 8.7 |
| Accounts Payable, % | 100 | 100 | 100 | 405.1 | 88.87 | 97.77 | 97.77 | 97.77 | 97.77 | 97.77 |
| Capital Expenditure | -.8 | -1.4 | -4.9 | -6.0 | -1.0 | -1.0 | -1.2 | -1.5 | -1.9 | -2.4 |
| Capital Expenditure, % | 100 | 100 | 100 | -787.19 | -33.32 | -26.66 | -26.66 | -26.66 | -26.66 | -26.66 |
| Tax Rate, % | 0 | 0 | 0 | 0 | 0 | 0 | 0 | 0 | 0 | 0 |
| EBITAT | -12.3 | -27.7 | -61.8 | -87.5 | -93.7 | .7 | .9 | 1.1 | 1.4 | 1.8 |
| Depreciation | ||||||||||
| Changes in Account Receivables | ||||||||||
| Changes in Inventories | ||||||||||
| Changes in Accounts Payable | ||||||||||
| Capital Expenditure | ||||||||||
| UFCF | -12.2 | -28.6 | -67.6 | -102.9 | -82.9 | 12.6 | 3.4 | 4.2 | 5.3 | 6.6 |
| WACC, % | 7.77 | 7.77 | 7.77 | 7.69 | 7.77 | 7.75 | 7.75 | 7.75 | 7.75 | 7.75 |
| PV UFCF | ||||||||||
| SUM PV UFCF | 26.5 | |||||||||
| Long Term Growth Rate, % | 2.00 | |||||||||
| Free cash flow (T + 1) | 7 | |||||||||
| Terminal Value | 118 | |||||||||
| Present Terminal Value | 81 | |||||||||
| Enterprise Value | 107 | |||||||||
| Net Debt | 59 | |||||||||
| Equity Value | 48 | |||||||||
| Diluted Shares Outstanding, MM | 2 | |||||||||
| Equity Value Per Share | 19.93 |
What You Will Get
- Real OMIC Data: Preloaded financials – from revenue to EBIT – based on actual and projected figures for Singular Genomics Systems, Inc.
- Full Customization: Adjust all critical parameters (yellow cells) like WACC, growth %, and tax rates specific to [OMIC].
- Instant Valuation Updates: Automatic recalculations to analyze the impact of changes on Singular Genomics' fair value.
- Versatile Excel Template: Tailored for quick edits, scenario testing, and detailed projections for [OMIC].
- Time-Saving and Accurate: Skip building models from scratch while maintaining precision and flexibility for Singular Genomics Systems, Inc.
Key Features
- Comprehensive Genomic Analysis Tools: Offers advanced tools for sequencing and data analysis tailored for genomic research.
- Customizable Bioinformatics Solutions: Pre-configured bioinformatics pipelines with options for user-defined parameters.
- Flexible Data Integration: Easily integrate various data types, including genomic, transcriptomic, and proteomic data.
- Built-In Analytical Metrics: Evaluate key performance indicators for genomic data interpretation.
- User-Friendly Dashboard: Interactive visualizations provide a clear overview of genomic insights and trends.
How It Works
- 1. Access the Template: Download and open the Excel file containing Singular Genomics Systems, Inc.'s preloaded data.
- 2. Modify Assumptions: Adjust key parameters such as growth rates, WACC, and capital expenditures.
- 3. Analyze Results in Real-Time: The DCF model automatically computes intrinsic value and NPV.
- 4. Explore Scenarios: Evaluate various forecasts to assess different valuation results.
- 5. Present with Assurance: Share professional valuation insights to bolster your decision-making process.
Why Choose This Calculator for Singular Genomics Systems, Inc. (OMIC)?
- Accurate Data: Utilize real financials from Singular Genomics for dependable valuation outcomes.
- Customizable: Tailor essential parameters such as growth rates, WACC, and tax rates to align with your forecasts.
- Time-Saving: Ready-made calculations save you the effort of starting from the ground up.
- Professional-Grade Tool: Crafted for investors, analysts, and consultants in the biotech sector.
- User-Friendly: An intuitive design and clear step-by-step guidance make it accessible for all users.
Who Should Use This Product?
- Investors: Evaluate Singular Genomics' (OMIC) market position before making investment decisions.
- CFOs and Financial Analysts: Optimize valuation methodologies and assess financial forecasts for accuracy.
- Biotech Entrepreneurs: Understand the valuation strategies of leading genomic companies like Singular Genomics.
- Consultants: Provide comprehensive valuation analyses and reports for biotechnology clients.
- Students and Educators: Utilize current genomic industry data to learn and teach valuation practices.
What the Template Contains
- Comprehensive DCF Model: Editable template with detailed valuation calculations tailored for Singular Genomics Systems, Inc. (OMIC).
- Real-World Data: Singular Genomics’ historical and projected financials preloaded for thorough analysis.
- Customizable Parameters: Adjust WACC, growth rates, and tax assumptions to explore various scenarios.
- Financial Statements: Complete annual and quarterly breakdowns for enhanced insights.
- Key Ratios: Integrated analysis for profitability, efficiency, and leverage metrics.
- Dashboard with Visual Outputs: Interactive charts and tables for clear, actionable results.
Disclaimer
All information, articles, and product details provided on this website are for general informational and educational purposes only. We do not claim any ownership over, nor do we intend to infringe upon, any trademarks, copyrights, logos, brand names, or other intellectual property mentioned or depicted on this site. Such intellectual property remains the property of its respective owners, and any references here are made solely for identification or informational purposes, without implying any affiliation, endorsement, or partnership.
We make no representations or warranties, express or implied, regarding the accuracy, completeness, or suitability of any content or products presented. Nothing on this website should be construed as legal, tax, investment, financial, medical, or other professional advice. In addition, no part of this site—including articles or product references—constitutes a solicitation, recommendation, endorsement, advertisement, or offer to buy or sell any securities, franchises, or other financial instruments, particularly in jurisdictions where such activity would be unlawful.
All content is of a general nature and may not address the specific circumstances of any individual or entity. It is not a substitute for professional advice or services. Any actions you take based on the information provided here are strictly at your own risk. You accept full responsibility for any decisions or outcomes arising from your use of this website and agree to release us from any liability in connection with your use of, or reliance upon, the content or products found herein.