
|
Na Inovation Inc. (para) Avaliação DCF |
Totalmente Editável: Adapte-Se Às Suas Necessidades No Excel Ou Planilhas
Design Profissional: Modelos Confiáveis E Padrão Da Indústria
Pré-Construídos Para Uso Rápido E Eficiente
Compatível com MAC/PC, totalmente desbloqueado
Não É Necessária Experiência; Fácil De Seguir
Onto Innovation Inc. (ONTO) Bundle
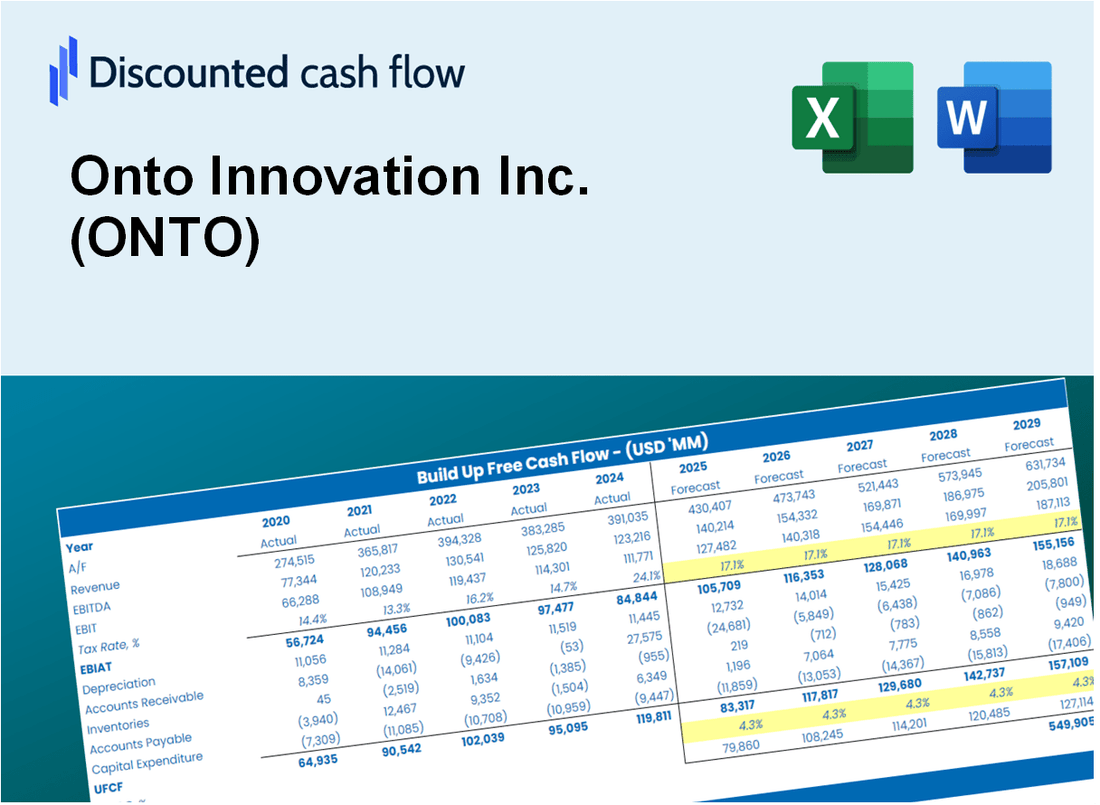
Obtenha informações sobre o seu On Innovation Inc. (para) Análise de avaliação com nossa calculadora DCF de ponta! Equipado com dados reais (para), este modelo do Excel permite ajustar as previsões e suposições para calcular com precisão o valor intrínseco da Innovation Inc.
What You Will Get
- Editable Forecast Inputs: Easily modify assumptions (growth %, margins, WACC) to explore various scenarios.
- Real-World Data: Onto Innovation Inc.’s financial data pre-filled to kickstart your analysis.
- Automatic DCF Outputs: The template computes Net Present Value (NPV) and intrinsic value for you.
- Customizable and Professional: A refined Excel model that adjusts to your valuation requirements.
- Built for Analysts and Investors: Perfect for evaluating projections, validating strategies, and enhancing efficiency.
Key Features
- Comprehensive Data Access: Onto Innovation Inc.’s historical financial records and projected forecasts are readily available.
- Customizable Parameters: Adjust inputs such as WACC, tax rates, revenue growth, and EBITDA margins to suit your analysis.
- Real-Time Valuation: Instantly view the recalculated intrinsic value of Onto Innovation Inc. as you modify inputs.
- Intuitive Visuals: Interactive dashboard charts present valuation outcomes and essential metrics clearly.
- Designed for Precision: A robust tool tailored for analysts, investors, and finance professionals.
How It Works
- Download the Template: Gain immediate access to the Excel-based ONTO DCF Calculator.
- Input Your Assumptions: Modify the yellow-highlighted cells for growth rates, WACC, margins, and additional factors.
- Instant Calculations: The model automatically recalculates Onto Innovation's intrinsic value.
- Test Scenarios: Experiment with various assumptions to assess potential changes in valuation.
- Analyze and Decide: Utilize the outcomes to inform your investment or financial strategy.
Why Choose This Calculator for Onto Innovation Inc. (ONTO)?
- Accurate Data: Up-to-date Onto Innovation financials provide dependable valuation outcomes.
- Customizable: Tailor key inputs such as growth rates, WACC, and tax rates to align with your forecasts.
- Time-Saving: Ready-made calculations save you the hassle of starting from the ground up.
- Professional-Grade Tool: Crafted for investors, analysts, and consultants in the tech sector.
- User-Friendly: Simple design and clear, step-by-step guidance ensure accessibility for all users.
Who Should Use This Product?
- Investors: Accurately assess Onto Innovation Inc.'s (ONTO) fair value prior to making investment choices.
- CFOs: Utilize a high-quality DCF model for financial reporting and analysis specific to Onto Innovation Inc. (ONTO).
- Consultants: Swiftly customize the template for valuation reports tailored to Onto Innovation Inc. (ONTO) clients.
- Entrepreneurs: Acquire insights into financial modeling practices employed by leading technology firms like Onto Innovation Inc. (ONTO).
- Educators: Implement it as a teaching resource to illustrate valuation techniques relevant to Onto Innovation Inc. (ONTO).
What the Template Contains
- Preloaded ONTO Data: Historical and projected financial data, including revenue, EBIT, and capital expenditures.
- DCF and WACC Models: Professional-grade sheets for calculating intrinsic value and Weighted Average Cost of Capital.
- Editable Inputs: Yellow-highlighted cells for adjusting revenue growth, tax rates, and discount rates.
- Financial Statements: Comprehensive annual and quarterly financials for deeper analysis.
- Key Ratios: Profitability, leverage, and efficiency ratios to evaluate performance.
- Dashboard and Charts: Visual summaries of valuation outcomes and assumptions.
Disclaimer
All information, articles, and product details provided on this website are for general informational and educational purposes only. We do not claim any ownership over, nor do we intend to infringe upon, any trademarks, copyrights, logos, brand names, or other intellectual property mentioned or depicted on this site. Such intellectual property remains the property of its respective owners, and any references here are made solely for identification or informational purposes, without implying any affiliation, endorsement, or partnership.
We make no representations or warranties, express or implied, regarding the accuracy, completeness, or suitability of any content or products presented. Nothing on this website should be construed as legal, tax, investment, financial, medical, or other professional advice. In addition, no part of this site—including articles or product references—constitutes a solicitation, recommendation, endorsement, advertisement, or offer to buy or sell any securities, franchises, or other financial instruments, particularly in jurisdictions where such activity would be unlawful.
All content is of a general nature and may not address the specific circumstances of any individual or entity. It is not a substitute for professional advice or services. Any actions you take based on the information provided here are strictly at your own risk. You accept full responsibility for any decisions or outcomes arising from your use of this website and agree to release us from any liability in connection with your use of, or reliance upon, the content or products found herein.