
|
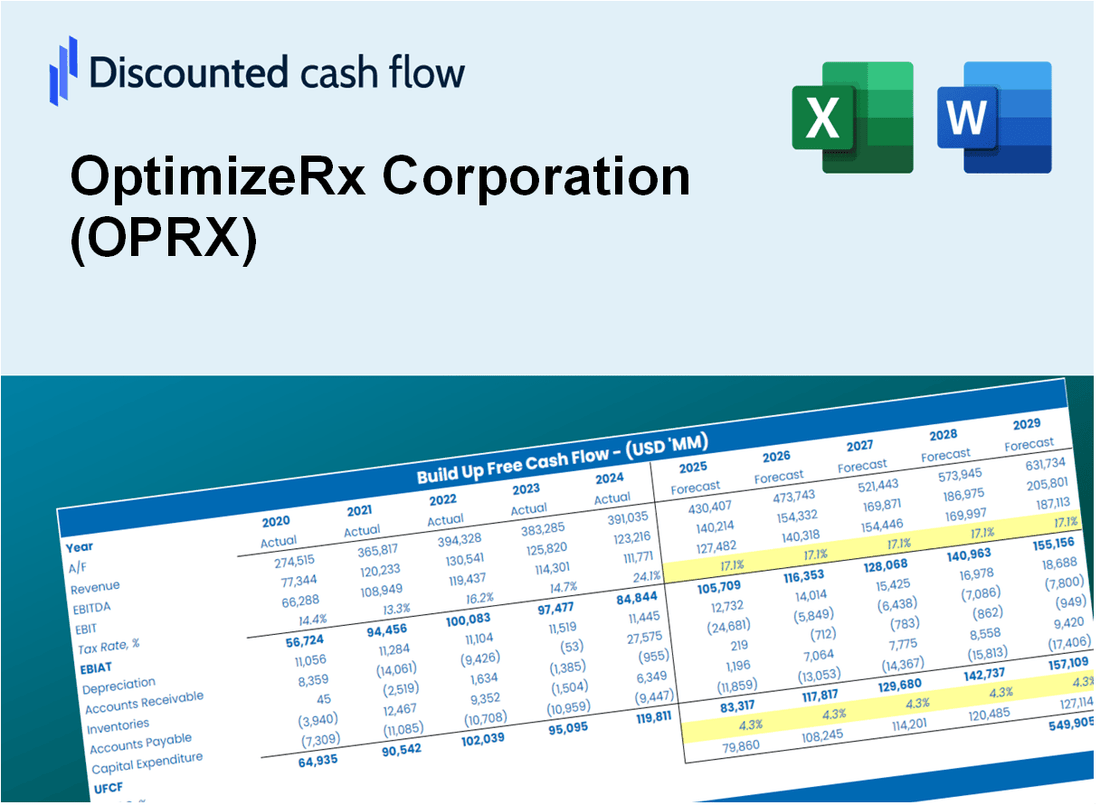
Avaliação DCF da OptimizerX Corporation (OPRX) |
Totalmente Editável: Adapte-Se Às Suas Necessidades No Excel Ou Planilhas
Design Profissional: Modelos Confiáveis E Padrão Da Indústria
Pré-Construídos Para Uso Rápido E Eficiente
Compatível com MAC/PC, totalmente desbloqueado
Não É Necessária Experiência; Fácil De Seguir
OptimizeRx Corporation (OPRX) Bundle
Otimize seu tempo e melhore a precisão com a calculadora DCF da OptimizerSizerX Corporation (OPRX)! Equipado com dados autênticos e suposições personalizáveis, essa ferramenta permite que você preveja, analise e avalie a OptimizerX Corporation (OPRX), assim como um investidor experiente.
Discounted Cash Flow (DCF) - (USD MM)
| Year | AY1 2020 |
AY2 2021 |
AY3 2022 |
AY4 2023 |
AY5 2024 |
FY1 2025 |
FY2 2026 |
FY3 2027 |
FY4 2028 |
FY5 2029 |
|---|---|---|---|---|---|---|---|---|---|---|
| Revenue | 43.3 | 61.3 | 62.5 | 71.5 | 92.1 | 112.1 | 136.4 | 166.0 | 202.0 | 245.8 |
| Revenue Growth, % | 0 | 41.51 | 1.89 | 14.53 | 28.81 | 21.68 | 21.68 | 21.68 | 21.68 | 21.68 |
| EBITDA | .6 | 2.3 | -9.4 | -21.3 | -8.9 | -11.0 | -13.4 | -16.3 | -19.9 | -24.2 |
| EBITDA, % | 1.49 | 3.8 | -15.08 | -29.79 | -9.66 | -9.85 | -9.85 | -9.85 | -9.85 | -9.85 |
| Depreciation | 2.0 | 2.0 | 2.0 | 2.4 | 4.3 | 4.3 | 5.2 | 6.3 | 7.7 | 9.4 |
| Depreciation, % | 4.55 | 3.21 | 3.24 | 3.36 | 4.7 | 3.81 | 3.81 | 3.81 | 3.81 | 3.81 |
| EBIT | -1.3 | .4 | -11.4 | -23.7 | -13.2 | -15.3 | -18.6 | -22.7 | -27.6 | -33.6 |
| EBIT, % | -3.06 | 0.58914 | -18.32 | -33.15 | -14.36 | -13.66 | -13.66 | -13.66 | -13.66 | -13.66 |
| Total Cash | 10.5 | 84.7 | 74.1 | 13.9 | 13.4 | 57.9 | 70.4 | 85.7 | 104.3 | 126.9 |
| Total Cash, percent | .0 | .0 | .0 | .0 | .0 | .0 | .0 | .0 | .0 | .0 |
| Account Receivables | 17.9 | 24.8 | 22.2 | 37.3 | 38.2 | 47.3 | 57.5 | 70.0 | 85.2 | 103.6 |
| Account Receivables, % | 41.29 | 40.46 | 35.48 | 52.14 | 41.48 | 42.17 | 42.17 | 42.17 | 42.17 | 42.17 |
| Inventories | .0 | .0 | .0 | .0 | .0 | .0 | .0 | .0 | .0 | .0 |
| Inventories, % | 0 | 0 | 0 | 0 | 0 | 0 | 0 | 0 | 0 | 0 |
| Accounts Payable | .6 | .6 | 1.5 | 2.2 | 2.2 | 2.3 | 2.8 | 3.4 | 4.2 | 5.1 |
| Accounts Payable, % | 1.43 | 0.99002 | 2.48 | 3.11 | 2.34 | 2.07 | 2.07 | 2.07 | 2.07 | 2.07 |
| Capital Expenditure | -.1 | -.5 | -.2 | -.9 | -.1 | -.6 | -.8 | -.9 | -1.1 | -1.4 |
| Capital Expenditure, % | -0.28796 | -0.79292 | -0.39162 | -1.22 | -0.12157 | -0.56237 | -0.56237 | -0.56237 | -0.56237 | -0.56237 |
| Tax Rate, % | -3.74 | -3.74 | -3.74 | -3.74 | -3.74 | -3.74 | -3.74 | -3.74 | -3.74 | -3.74 |
| EBITAT | -1.3 | .4 | -11.4 | -16.6 | -13.7 | -14.4 | -17.5 | -21.3 | -25.9 | -31.5 |
| Depreciation | ||||||||||
| Changes in Account Receivables | ||||||||||
| Changes in Inventories | ||||||||||
| Changes in Accounts Payable | ||||||||||
| Capital Expenditure | ||||||||||
| UFCF | -16.7 | -5.1 | -6.1 | -29.5 | -10.5 | -19.6 | -22.8 | -27.8 | -33.8 | -41.1 |
| WACC, % | 9.86 | 9.86 | 9.86 | 9.26 | 9.86 | 9.74 | 9.74 | 9.74 | 9.74 | 9.74 |
| PV UFCF | ||||||||||
| SUM PV UFCF | -107.0 | |||||||||
| Long Term Growth Rate, % | 2.00 | |||||||||
| Free cash flow (T + 1) | -42 | |||||||||
| Terminal Value | -542 | |||||||||
| Present Terminal Value | -341 | |||||||||
| Enterprise Value | -448 | |||||||||
| Net Debt | 20 | |||||||||
| Equity Value | -467 | |||||||||
| Diluted Shares Outstanding, MM | 18 | |||||||||
| Equity Value Per Share | -25.55 |
What You Will Receive
- Adjustable Forecast Inputs: Effortlessly modify assumptions (growth %, margins, WACC) to explore various scenarios.
- Comprehensive Data: OptimizeRx Corporation’s financial information pre-loaded to facilitate your analysis.
- Instant DCF Outputs: The template computes Net Present Value (NPV) and intrinsic value automatically.
- Tailored and Professional: A refined Excel model that customizes to fit your valuation requirements.
- Designed for Analysts and Investors: Perfect for evaluating projections, confirming strategies, and streamlining your workflow.
Key Features
- Comprehensive DCF Calculator: Features in-depth unlevered and levered DCF valuation models tailored for OptimizeRx Corporation (OPRX).
- WACC Calculator: Comes with a pre-configured Weighted Average Cost of Capital sheet that allows for customizable inputs.
- Adjustable Forecast Assumptions: Easily alter growth rates, capital expenditures, and discount rates to fit your analysis.
- Integrated Financial Ratios: Evaluate profitability, leverage, and efficiency ratios specifically for OptimizeRx Corporation (OPRX).
- User-Friendly Dashboard and Charts: Visual representations of key valuation metrics facilitate straightforward analysis.
How It Works
- 1. Access the Template: Download and open the Excel file containing OptimizeRx Corporation's (OPRX) financial data.
- 2. Adjust Key Inputs: Modify essential parameters such as revenue growth, discount rates, and investment expenditures.
- 3. See Immediate Results: The DCF model automatically computes the intrinsic value and net present value (NPV).
- 4. Explore Different Scenarios: Analyze various forecasts to evaluate multiple valuation possibilities.
- 5. Present with Assurance: Deliver expert valuation analyses to bolster your strategic decisions.
Why Choose This Calculator for OptimizeRx Corporation (OPRX)?
- Designed for Experts: A sophisticated tool utilized by financial analysts, CFOs, and industry consultants.
- Accurate Financial Data: OptimizeRx’s historical and forecasted financials are preloaded for precision.
- Forecast Simulation: Effortlessly test various scenarios and assumptions.
- Comprehensive Results: Automatically computes intrinsic value, NPV, and essential metrics.
- User-Friendly: Step-by-step guidance simplifies the entire process.
Who Should Use This Product?
- Investors: Accurately assess OptimizeRx Corporation’s (OPRX) fair value prior to making investment decisions.
- CFOs: Utilize a professional-grade DCF model for financial reporting and analysis related to OptimizeRx Corporation (OPRX).
- Consultants: Efficiently customize the template for valuation reports for clients involving OptimizeRx Corporation (OPRX).
- Entrepreneurs: Acquire insights into financial modeling practices employed by leading healthcare companies, including OptimizeRx Corporation (OPRX).
- Educators: Implement it as a teaching resource to illustrate valuation methodologies with a focus on OptimizeRx Corporation (OPRX).
What the Template Contains
- Preloaded OPRX Data: Historical and projected financial data, including revenue, EBIT, and capital expenditures.
- DCF and WACC Models: Professional-grade sheets for calculating intrinsic value and Weighted Average Cost of Capital.
- Editable Inputs: Yellow-highlighted cells for adjusting revenue growth, tax rates, and discount rates.
- Financial Statements: Comprehensive annual and quarterly financials for deeper analysis.
- Key Ratios: Profitability, leverage, and efficiency ratios to evaluate performance.
- Dashboard and Charts: Visual summaries of valuation outcomes and assumptions.
Disclaimer
All information, articles, and product details provided on this website are for general informational and educational purposes only. We do not claim any ownership over, nor do we intend to infringe upon, any trademarks, copyrights, logos, brand names, or other intellectual property mentioned or depicted on this site. Such intellectual property remains the property of its respective owners, and any references here are made solely for identification or informational purposes, without implying any affiliation, endorsement, or partnership.
We make no representations or warranties, express or implied, regarding the accuracy, completeness, or suitability of any content or products presented. Nothing on this website should be construed as legal, tax, investment, financial, medical, or other professional advice. In addition, no part of this site—including articles or product references—constitutes a solicitation, recommendation, endorsement, advertisement, or offer to buy or sell any securities, franchises, or other financial instruments, particularly in jurisdictions where such activity would be unlawful.
All content is of a general nature and may not address the specific circumstances of any individual or entity. It is not a substitute for professional advice or services. Any actions you take based on the information provided here are strictly at your own risk. You accept full responsibility for any decisions or outcomes arising from your use of this website and agree to release us from any liability in connection with your use of, or reliance upon, the content or products found herein.