
|
Opthea Limited (OPT) DCF Avaliação |
Totalmente Editável: Adapte-Se Às Suas Necessidades No Excel Ou Planilhas
Design Profissional: Modelos Confiáveis E Padrão Da Indústria
Pré-Construídos Para Uso Rápido E Eficiente
Compatível com MAC/PC, totalmente desbloqueado
Não É Necessária Experiência; Fácil De Seguir
Opthea Limited (OPT) Bundle
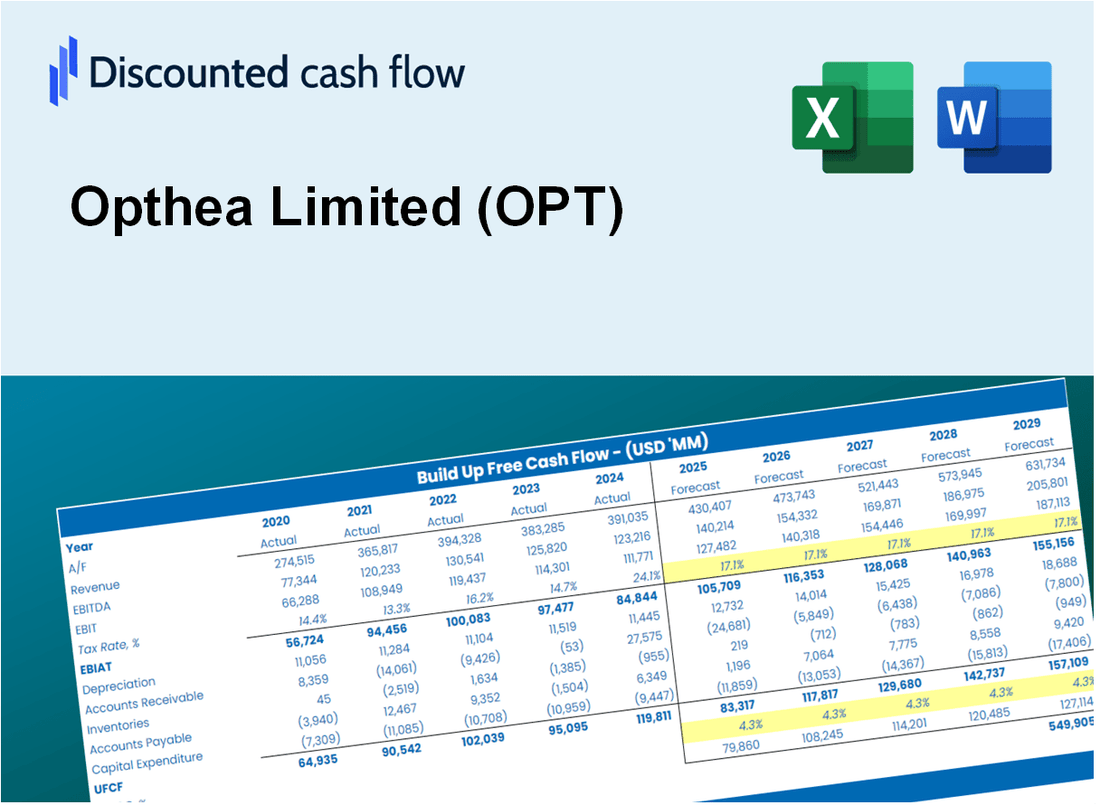
Explore as perspectivas financeiras da Opthea Limited (OPT) com nossa calculadora DCF! Digite suas suposições sobre taxas de crescimento, margens de lucro e despesas para calcular o valor intrínseco da Opthea Limited (OPT) e informe suas decisões de investimento.
What You Will Receive
- Comprehensive Financial Model: Utilizes Opthea Limited’s (OPT) actual data for accurate DCF valuation.
- Complete Forecast Flexibility: Modify revenue growth, profit margins, WACC, and other essential factors.
- Real-Time Calculations: Instant updates allow you to view results immediately as adjustments are made.
- Professional-Grade Template: A polished Excel file crafted for high-quality valuation presentations.
- Adaptable and Reusable: Designed for versatility, enabling multiple uses for thorough forecasting.
Key Features
- Comprehensive Historical Data: Opthea Limited’s (OPT) past financial statements and pre-filled projections.
- Customizable Parameters: Adjust WACC, tax rates, revenue growth, and EBITDA margins to fit your analysis.
- Real-Time Valuation: Instantly view the recalculated intrinsic value of Opthea Limited (OPT).
- Visual Insights: Dashboard charts present valuation outcomes and essential metrics clearly.
- Designed for Precision: A reliable tool tailored for analysts, investors, and finance professionals.
How It Works
- Step 1: Download the Excel file.
- Step 2: Review pre-entered Opthea Limited (OPT) data (historical and projected).
- Step 3: Adjust key assumptions (yellow cells) based on your analysis.
- Step 4: View automatic recalculations for Opthea Limited’s intrinsic value.
- Step 5: Use the outputs for investment decisions or reporting.
Why Choose Opthea Limited (OPT)?
- Innovative Solutions: Benefit from cutting-edge therapies tailored for eye diseases.
- Proven Efficacy: Clinical trials demonstrate the effectiveness of our treatments.
- Patient-Centric Approach: We prioritize the needs and experiences of our patients.
- Expert Team: Our professionals are leaders in ophthalmology and biotechnology.
- Strong Commitment: Dedicated to advancing research and improving patient outcomes.
Who Should Use This Product?
- Individual Investors: Make informed decisions about buying or selling Opthea Limited (OPT) stock.
- Financial Analysts: Streamline valuation processes with ready-to-use financial models specific to Opthea Limited (OPT).
- Consultants: Deliver professional valuation insights on Opthea Limited (OPT) to clients quickly and accurately.
- Business Owners: Understand how biopharmaceutical companies like Opthea Limited (OPT) are valued to guide your own strategy.
- Finance Students: Learn valuation techniques using real-world data and scenarios related to Opthea Limited (OPT).
What the Template Contains
- Pre-Filled Data: Includes Opthea Limited’s historical financials and forecasts.
- Discounted Cash Flow Model: Editable DCF valuation model with automatic calculations.
- Weighted Average Cost of Capital (WACC): A dedicated sheet for calculating WACC based on custom inputs.
- Key Financial Ratios: Analyze Opthea Limited’s profitability, efficiency, and leverage.
- Customizable Inputs: Edit revenue growth, margins, and tax rates with ease.
- Clear Dashboard: Charts and tables summarizing key valuation results.
Disclaimer
All information, articles, and product details provided on this website are for general informational and educational purposes only. We do not claim any ownership over, nor do we intend to infringe upon, any trademarks, copyrights, logos, brand names, or other intellectual property mentioned or depicted on this site. Such intellectual property remains the property of its respective owners, and any references here are made solely for identification or informational purposes, without implying any affiliation, endorsement, or partnership.
We make no representations or warranties, express or implied, regarding the accuracy, completeness, or suitability of any content or products presented. Nothing on this website should be construed as legal, tax, investment, financial, medical, or other professional advice. In addition, no part of this site—including articles or product references—constitutes a solicitation, recommendation, endorsement, advertisement, or offer to buy or sell any securities, franchises, or other financial instruments, particularly in jurisdictions where such activity would be unlawful.
All content is of a general nature and may not address the specific circumstances of any individual or entity. It is not a substitute for professional advice or services. Any actions you take based on the information provided here are strictly at your own risk. You accept full responsibility for any decisions or outcomes arising from your use of this website and agree to release us from any liability in connection with your use of, or reliance upon, the content or products found herein.