
|
Origin Materials, Inc. (ORGN) Avaliação DCF |
Totalmente Editável: Adapte-Se Às Suas Necessidades No Excel Ou Planilhas
Design Profissional: Modelos Confiáveis E Padrão Da Indústria
Pré-Construídos Para Uso Rápido E Eficiente
Compatível com MAC/PC, totalmente desbloqueado
Não É Necessária Experiência; Fácil De Seguir
Origin Materials, Inc. (ORGN) Bundle
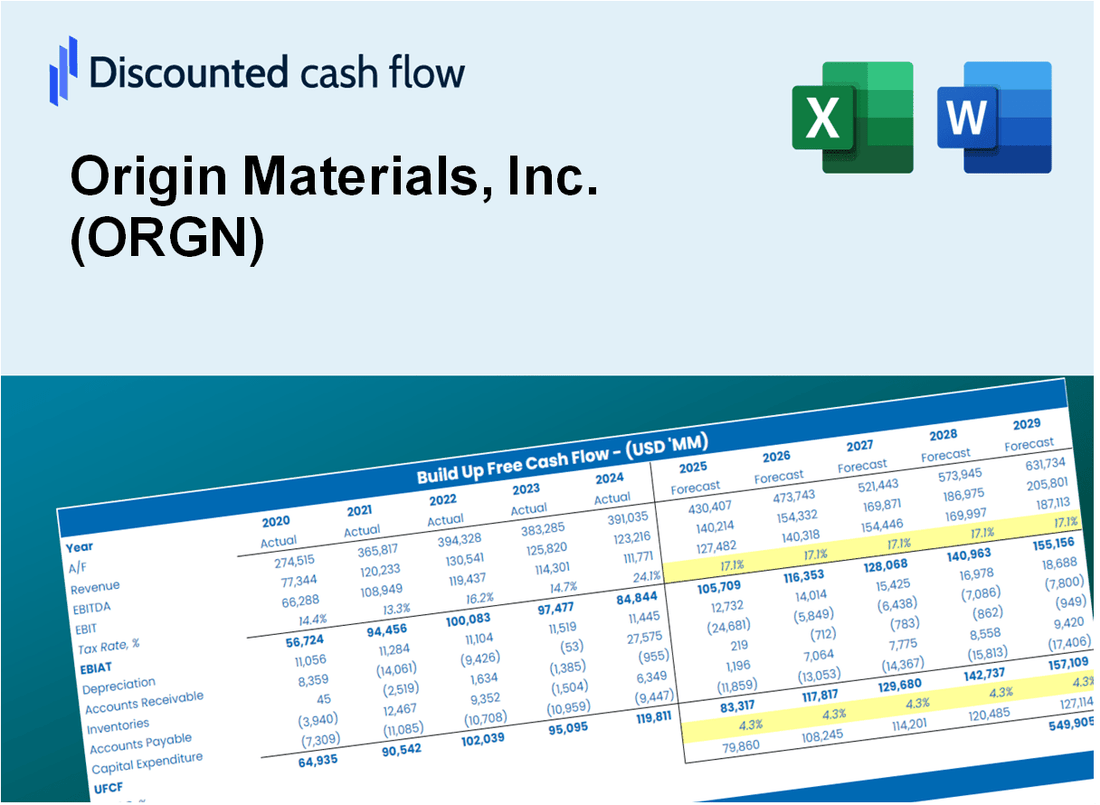
Avaliação Simplify Origin Materials, Inc. (ORGN) com esta calculadora DCF personalizável! Apresentando o Real Origin Materials, Inc. (ORGN) financeiras e insumos de previsão ajustáveis, você pode testar cenários e descobrir o valor justo da Origin Materials, Inc. (ORGN) em minutos.
What You Will Get
- Editable Forecast Inputs: Effortlessly adjust key assumptions (growth %, margins, WACC) to explore various scenarios.
- Real-World Data: Origin Materials, Inc.'s (ORGN) financial data pre-loaded to kickstart your analysis.
- Automatic DCF Outputs: The template computes Net Present Value (NPV) and intrinsic value automatically.
- Customizable and Professional: A sleek Excel model that can be tailored to meet your valuation requirements.
- Built for Analysts and Investors: Perfect for evaluating projections, confirming strategies, and enhancing efficiency.
Key Features
- Pre-Loaded Data: Origin Materials’ historical financial statements and pre-filled forecasts.
- Fully Adjustable Inputs: Modify WACC, tax rates, revenue growth, and EBITDA margins as needed.
- Instant Results: View Origin Materials’ intrinsic value recalculating in real time.
- Clear Visual Outputs: Dashboard charts showcase valuation results and essential metrics.
- Built for Accuracy: A professional tool designed for analysts, investors, and finance professionals.
How It Works
- Step 1: Download the Excel file.
- Step 2: Review pre-entered Origin Materials data (historical and projected).
- Step 3: Adjust key assumptions (yellow cells) based on your analysis.
- Step 4: View automatic recalculations for Origin Materials’ intrinsic value.
- Step 5: Use the outputs for investment decisions or reporting.
Why Choose This Calculator for Origin Materials, Inc. (ORGN)?
- Accurate Data: Utilizes real Origin Materials financials to deliver dependable valuation outcomes.
- Customizable: Tailor essential inputs such as growth rates, WACC, and tax rates to align with your forecasts.
- Time-Saving: Pre-configured calculations remove the hassle of starting from the ground up.
- Professional-Grade Tool: Crafted for investors, analysts, and consultants in the field.
- User-Friendly: Designed with an intuitive interface and clear instructions for ease of use by everyone.
Who Should Use This Product?
- Individual Investors: Make informed decisions about buying or selling Origin Materials, Inc. (ORGN) stock.
- Financial Analysts: Streamline valuation processes with ready-to-use financial models specific to Origin Materials, Inc. (ORGN).
- Consultants: Deliver professional valuation insights on Origin Materials, Inc. (ORGN) to clients quickly and accurately.
- Business Owners: Understand how innovative companies like Origin Materials, Inc. (ORGN) are valued to guide your own strategy.
- Finance Students: Learn valuation techniques using real-world data and scenarios related to Origin Materials, Inc. (ORGN).
What the Template Contains
- Historical Data: Includes Origin Materials, Inc. (ORGN) past financials and baseline forecasts.
- DCF and Levered DCF Models: Detailed templates to calculate Origin Materials, Inc. (ORGN)'s intrinsic value.
- WACC Sheet: Pre-built calculations for Weighted Average Cost of Capital.
- Editable Inputs: Modify key drivers like growth rates, EBITDA %, and CAPEX assumptions.
- Quarterly and Annual Statements: A complete breakdown of Origin Materials, Inc. (ORGN)'s financials.
- Interactive Dashboard: Visualize valuation results and projections dynamically.
Disclaimer
All information, articles, and product details provided on this website are for general informational and educational purposes only. We do not claim any ownership over, nor do we intend to infringe upon, any trademarks, copyrights, logos, brand names, or other intellectual property mentioned or depicted on this site. Such intellectual property remains the property of its respective owners, and any references here are made solely for identification or informational purposes, without implying any affiliation, endorsement, or partnership.
We make no representations or warranties, express or implied, regarding the accuracy, completeness, or suitability of any content or products presented. Nothing on this website should be construed as legal, tax, investment, financial, medical, or other professional advice. In addition, no part of this site—including articles or product references—constitutes a solicitation, recommendation, endorsement, advertisement, or offer to buy or sell any securities, franchises, or other financial instruments, particularly in jurisdictions where such activity would be unlawful.
All content is of a general nature and may not address the specific circumstances of any individual or entity. It is not a substitute for professional advice or services. Any actions you take based on the information provided here are strictly at your own risk. You accept full responsibility for any decisions or outcomes arising from your use of this website and agree to release us from any liability in connection with your use of, or reliance upon, the content or products found herein.