
|
Oxford Lane Capital Corp. (OXLCP) Avaliação DCF |
Totalmente Editável: Adapte-Se Às Suas Necessidades No Excel Ou Planilhas
Design Profissional: Modelos Confiáveis E Padrão Da Indústria
Pré-Construídos Para Uso Rápido E Eficiente
Compatível com MAC/PC, totalmente desbloqueado
Não É Necessária Experiência; Fácil De Seguir
Oxford Lane Capital Corp. (OXLCP) Bundle
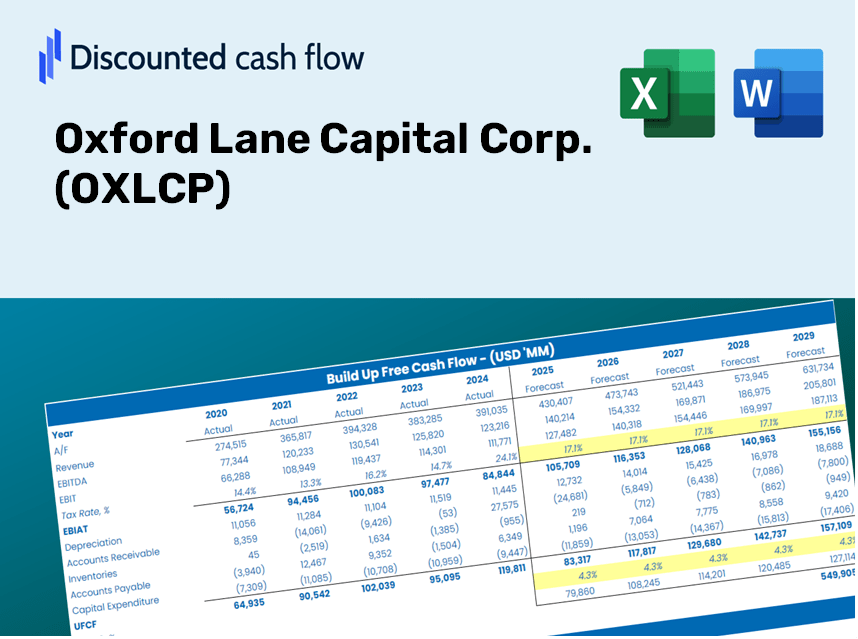
Assuma o controle da análise de avaliação de Oxford Lane Capital Corp. (OXLCP) com nossa calculadora DCF de ponta! Pré -carregado com dados reais (OXLCP), este modelo do Excel permite ajustar as previsões e suposições para determinar com precisão o valor intrínseco da Oxford Lane Capital Corp. (OxLCP).
Discounted Cash Flow (DCF) - (USD MM)
| Year | AY1 2021 |
AY2 2022 |
AY3 2023 |
AY4 2024 |
AY5 2025 |
FY1 2026 |
FY2 2027 |
FY3 2028 |
FY4 2029 |
FY5 2030 |
|---|---|---|---|---|---|---|---|---|---|---|
| Revenue | 58.3 | 152.2 | -126.6 | 279.5 | 95.8 | 56.1 | 32.8 | 19.2 | 11.3 | 6.6 |
| Revenue Growth, % | 0 | 161.29 | -183.19 | -320.74 | -65.74 | -41.43 | -41.43 | -41.43 | -41.43 | -41.43 |
| EBITDA | 306.2 | 125.9 | -171.3 | 235.1 | 48.5 | 46.8 | 27.4 | 16.1 | 9.4 | 5.5 |
| EBITDA, % | 525.6 | 82.69 | 135.27 | 84.11 | 50.6 | 83.48 | 83.48 | 83.48 | 83.48 | 83.48 |
| Depreciation | .0 | .0 | .0 | .0 | .0 | .0 | .0 | .0 | .0 | .0 |
| Depreciation, % | 0 | 0 | 0 | 0 | 0 | 0 | 0 | 0 | 0 | 0 |
| EBIT | 306.2 | 125.9 | -171.3 | 235.1 | 48.5 | 46.8 | 27.4 | 16.1 | 9.4 | 5.5 |
| EBIT, % | 525.6 | 82.69 | 135.27 | 84.11 | 50.6 | 83.48 | 83.48 | 83.48 | 83.48 | 83.48 |
| Total Cash | 90.9 | 34.7 | 21.7 | 43.0 | 295.3 | 24.8 | 14.5 | 8.5 | 5.0 | 2.9 |
| Total Cash, percent | .0 | .0 | .0 | .0 | .0 | .0 | .0 | .0 | .0 | .0 |
| Account Receivables | 17.3 | 26.0 | 24.2 | 28.5 | 24.6 | 7.1 | 4.2 | 2.4 | 1.4 | .8 |
| Account Receivables, % | 29.62 | 17.07 | -19.09 | 10.18 | 25.74 | 12.7 | 12.7 | 12.7 | 12.7 | 12.7 |
| Inventories | .0 | .0 | .0 | .0 | .0 | .0 | .0 | .0 | .0 | .0 |
| Inventories, % | 0 | 0 | 0 | 0 | 0 | 0 | 0 | 0 | 0 | 0 |
| Accounts Payable | .0 | .0 | .0 | 2.4 | 1.4 | .3 | .2 | .1 | .1 | .0 |
| Accounts Payable, % | 0 | 0.02144164 | -0.02577551 | 0.86607 | 1.51 | 0.47509 | 0.47509 | 0.47509 | 0.47509 | 0.47509 |
| Capital Expenditure | .0 | .0 | .0 | .0 | .0 | .0 | .0 | .0 | .0 | .0 |
| Capital Expenditure, % | 0.000005149417 | 0 | 0 | 0 | 0 | 0 | 0 | 0 | 0 | 0 |
| Tax Rate, % | 0 | 0 | 0 | 0 | 0 | 0 | 0 | 0 | 0 | 0 |
| EBITAT | 306.2 | 125.9 | -171.3 | 235.1 | 48.5 | 46.8 | 27.4 | 16.1 | 9.4 | 5.5 |
| Depreciation | ||||||||||
| Changes in Account Receivables | ||||||||||
| Changes in Inventories | ||||||||||
| Changes in Accounts Payable | ||||||||||
| Capital Expenditure | ||||||||||
| UFCF | 289.0 | 117.2 | -169.5 | 233.2 | 51.3 | 63.2 | 30.3 | 17.7 | 10.4 | 6.1 |
| WACC, % | 7.51 | 7.51 | 7.51 | 7.51 | 7.51 | 7.51 | 7.51 | 7.51 | 7.51 | 7.51 |
| PV UFCF | ||||||||||
| SUM PV UFCF | 111.2 | |||||||||
| Long Term Growth Rate, % | 0.50 | |||||||||
| Free cash flow (T + 1) | 6 | |||||||||
| Terminal Value | 87 | |||||||||
| Present Terminal Value | 61 | |||||||||
| Enterprise Value | 172 | |||||||||
| Net Debt | 192 | |||||||||
| Equity Value | -20 | |||||||||
| Diluted Shares Outstanding, MM | 91 | |||||||||
| Equity Value Per Share | -0.22 |
Benefits You Will Receive
- Flexible Forecast Inputs: Modify key assumptions (growth %, margins, WACC) effortlessly to explore various scenarios.
- Actual Financial Data: Pre-filled financial information for Oxford Lane Capital Corp. (OXLCP) to kickstart your analysis.
- Instant DCF Calculations: The template automatically determines the Net Present Value (NPV) and intrinsic value for you.
- Customizable and Professional Design: A sleek Excel model that can be tailored to fit your valuation requirements.
- Designed for Analysts and Investors: Perfect for evaluating projections, validating strategies, and enhancing efficiency.
Key Features
- Customizable Investment Parameters: Adjust vital metrics such as dividend yield, portfolio allocation, and risk exposure.
- Instant DCF Valuation: Quickly determines intrinsic value, NPV, and various financial outputs.
- High-Precision Analytics: Incorporates Oxford Lane Capital's actual financial data to provide realistic valuation results.
- Simplified Scenario Analysis: Easily evaluate different investment scenarios and analyze the results.
- Efficiency-Boosting Tool: Remove the hassle of creating detailed financial models from the ground up.
How It Works
- Step 1: Download the prebuilt Excel template containing Oxford Lane Capital Corp.'s (OXLCP) data.
- Step 2: Navigate through the filled sections to familiarize yourself with the essential metrics.
- Step 3: Modify forecasts and assumptions in the editable yellow cells (WACC, growth, margins).
- Step 4: Instantly see updated results, including the intrinsic value of Oxford Lane Capital Corp. (OXLCP).
- Step 5: Use the outputs to make informed investment choices or generate comprehensive reports.
Why Opt for This Calculator?
- User-Friendly Interface: Crafted for both novices and seasoned users.
- Customizable Inputs: Easily adjust parameters to tailor your analysis.
- Real-Time Adjustments: Observe immediate changes to Oxford Lane Capital Corp.’s (OXLCP) valuation as you modify inputs.
- Pre-Loaded Data: Comes equipped with actual financial information for Oxford Lane Capital Corp. for swift evaluations.
- Preferred by Industry Experts: Utilized by investors and analysts for making informed financial choices.
Who Can Benefit from Oxford Lane Capital Corp. (OXLCP)?
- Institutional Investors: Develop comprehensive and trustworthy valuation models for informed investment decisions.
- Corporate Finance Departments: Evaluate valuation scenarios to steer strategic planning and decision-making.
- Financial Advisors and Consultants: Offer clients precise valuation insights related to Oxford Lane Capital Corp. (OXLCP).
- Students and Instructors: Leverage real-time data for hands-on financial modeling practice and education.
- Investment Enthusiasts: Gain insights into how companies like Oxford Lane Capital Corp. (OXLCP) are assessed within the market.
What the Template Includes
- Pre-Filled Data: Contains historical financials and projections for Oxford Lane Capital Corp. (OXLCP).
- Discounted Cash Flow Model: An editable DCF valuation model featuring automatic calculations.
- Weighted Average Cost of Capital (WACC): A dedicated sheet to compute WACC based on user-defined inputs.
- Key Financial Ratios: Evaluate Oxford Lane Capital Corp.'s profitability, efficiency, and leverage metrics.
- Customizable Inputs: Adjust revenue growth, profit margins, and tax rates effortlessly.
- Clear Dashboard: Visualizations and tables that summarize key valuation outcomes.
Disclaimer
All information, articles, and product details provided on this website are for general informational and educational purposes only. We do not claim any ownership over, nor do we intend to infringe upon, any trademarks, copyrights, logos, brand names, or other intellectual property mentioned or depicted on this site. Such intellectual property remains the property of its respective owners, and any references here are made solely for identification or informational purposes, without implying any affiliation, endorsement, or partnership.
We make no representations or warranties, express or implied, regarding the accuracy, completeness, or suitability of any content or products presented. Nothing on this website should be construed as legal, tax, investment, financial, medical, or other professional advice. In addition, no part of this site—including articles or product references—constitutes a solicitation, recommendation, endorsement, advertisement, or offer to buy or sell any securities, franchises, or other financial instruments, particularly in jurisdictions where such activity would be unlawful.
All content is of a general nature and may not address the specific circumstances of any individual or entity. It is not a substitute for professional advice or services. Any actions you take based on the information provided here are strictly at your own risk. You accept full responsibility for any decisions or outcomes arising from your use of this website and agree to release us from any liability in connection with your use of, or reliance upon, the content or products found herein.