
|
PayPoint plc (pay.l) avaliação dcf |
Totalmente Editável: Adapte-Se Às Suas Necessidades No Excel Ou Planilhas
Design Profissional: Modelos Confiáveis E Padrão Da Indústria
Pré-Construídos Para Uso Rápido E Eficiente
Compatível com MAC/PC, totalmente desbloqueado
Não É Necessária Experiência; Fácil De Seguir
PayPoint plc (PAY.L) Bundle
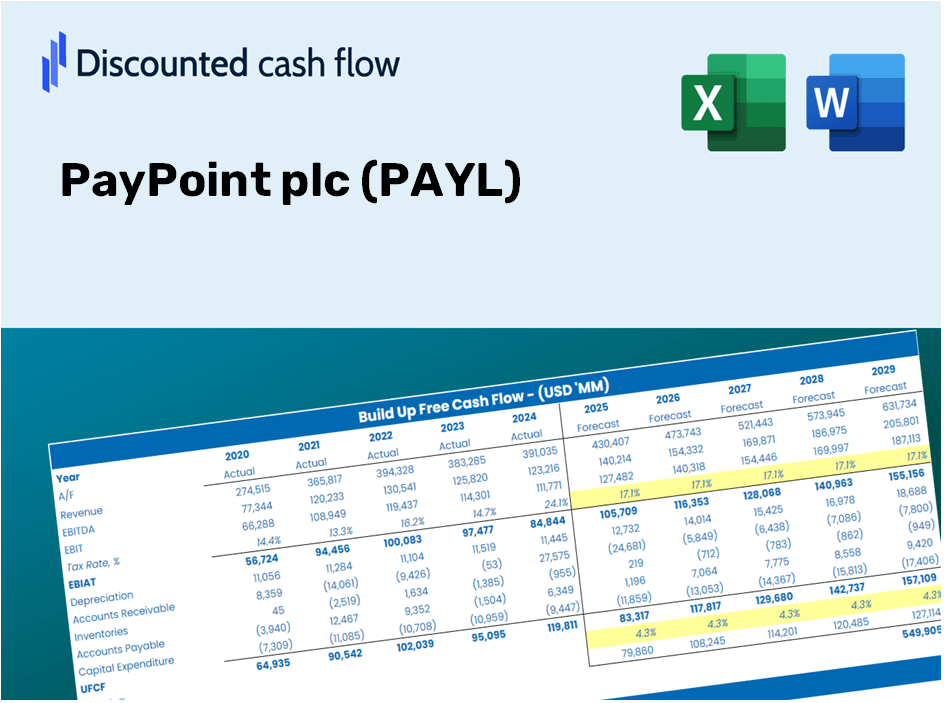
Obtenha uma visão da sua análise de avaliação do PayPoint PLC (Payl) usando nossa sofisticada calculadora DCF! Este modelo do Excel é pré -carregado com dados Payl reais, permitindo que você ajuste as previsões e suposições para determinar com precisão o valor intrínseco do PayPoint PLC.
Discounted Cash Flow (DCF) - (USD MM)
| Year | AY1 2021 |
AY2 2022 |
AY3 2023 |
AY4 2024 |
AY5 2025 |
FY1 2026 |
FY2 2027 |
FY3 2028 |
FY4 2029 |
FY5 2030 |
|---|---|---|---|---|---|---|---|---|---|---|
| Revenue | 127.7 | 145.1 | 167.7 | 306.4 | 310.7 | 398.7 | 511.6 | 656.4 | 842.3 | 1,080.8 |
| Revenue Growth, % | 0 | 13.62 | 15.56 | 82.66 | 1.42 | 28.31 | 28.31 | 28.31 | 28.31 | 28.31 |
| EBITDA | 30.6 | 61.1 | 55.7 | 77.3 | 60.0 | 114.7 | 147.1 | 188.8 | 242.2 | 310.8 |
| EBITDA, % | 23.93 | 42.12 | 33.22 | 25.22 | 19.32 | 28.76 | 28.76 | 28.76 | 28.76 | 28.76 |
| Depreciation | 8.7 | 10.6 | 10.5 | 20.7 | 25.3 | 28.1 | 36.1 | 46.3 | 59.4 | 76.2 |
| Depreciation, % | 6.82 | 7.28 | 6.25 | 6.75 | 8.14 | 7.05 | 7.05 | 7.05 | 7.05 | 7.05 |
| EBIT | 21.9 | 50.6 | 45.2 | 56.6 | 34.7 | 86.6 | 111.1 | 142.5 | 182.9 | 234.7 |
| EBIT, % | 17.11 | 34.84 | 26.97 | 18.47 | 11.18 | 21.71 | 21.71 | 21.71 | 21.71 | 21.71 |
| Total Cash | 10.5 | 24.3 | 160.5 | 86.8 | 33.2 | 127.3 | 163.4 | 209.6 | 269.0 | 345.1 |
| Total Cash, percent | .0 | .0 | .0 | .0 | .0 | .0 | .0 | .0 | .0 | .0 |
| Account Receivables | 69.6 | 66.5 | 82.8 | 117.2 | 110.0 | 178.1 | 228.5 | 293.2 | 376.2 | 482.7 |
| Account Receivables, % | 54.48 | 45.83 | 49.35 | 38.25 | 35.41 | 44.66 | 44.66 | 44.66 | 44.66 | 44.66 |
| Inventories | .5 | .3 | 3.2 | 3.3 | 6.2 | 4.4 | 5.7 | 7.3 | 9.4 | 12.0 |
| Inventories, % | 0.41097 | 0.22874 | 1.88 | 1.06 | 1.98 | 1.11 | 1.11 | 1.11 | 1.11 | 1.11 |
| Accounts Payable | 34.3 | 21.4 | 255.5 | 171.8 | 272.4 | 227.6 | 292.0 | 374.7 | 480.7 | 616.8 |
| Accounts Payable, % | 26.87 | 14.77 | 152.35 | 56.07 | 87.66 | 57.08 | 57.08 | 57.08 | 57.08 | 57.08 |
| Capital Expenditure | -11.2 | -10.8 | -12.7 | -16.2 | -18.8 | -28.0 | -36.0 | -46.1 | -59.2 | -76.0 |
| Capital Expenditure, % | -8.8 | -7.45 | -7.57 | -5.29 | -6.04 | -7.03 | -7.03 | -7.03 | -7.03 | -7.03 |
| Tax Rate, % | 27.01 | 27.01 | 27.01 | 27.01 | 27.01 | 27.01 | 27.01 | 27.01 | 27.01 | 27.01 |
| EBITAT | 23.9 | 41.4 | 36.9 | 41.9 | 25.4 | 71.0 | 91.2 | 117.0 | 150.1 | 192.6 |
| Depreciation | ||||||||||
| Changes in Account Receivables | ||||||||||
| Changes in Inventories | ||||||||||
| Changes in Accounts Payable | ||||||||||
| Capital Expenditure | ||||||||||
| UFCF | -14.4 | 31.5 | 249.7 | -71.9 | 136.7 | -40.0 | 104.0 | 133.5 | 171.2 | 219.7 |
| WACC, % | 5.43 | 5.16 | 5.16 | 5.05 | 5.03 | 5.17 | 5.17 | 5.17 | 5.17 | 5.17 |
| PV UFCF | ||||||||||
| SUM PV UFCF | 481.5 | |||||||||
| Long Term Growth Rate, % | 2.00 | |||||||||
| Free cash flow (T + 1) | 224 | |||||||||
| Terminal Value | 7,079 | |||||||||
| Present Terminal Value | 5,503 | |||||||||
| Enterprise Value | 5,985 | |||||||||
| Net Debt | 72 | |||||||||
| Equity Value | 5,913 | |||||||||
| Diluted Shares Outstanding, MM | 73 | |||||||||
| Equity Value Per Share | 8,102.73 |
What You Will Receive
- Comprehensive PAYL Financials: Access both historical and projected data for precise valuation.
- Customizable Inputs: Adjust WACC, tax rates, revenue growth, and capital expenses as needed.
- Automated Calculations: Intrinsic value and NPV are computed in real-time.
- Scenario Analysis: Explore various scenarios to assess PayPoint plc's future performance.
- User-Friendly Design: Crafted for industry experts but easy for newcomers to navigate.
Key Features
- Pre-Loaded Data: Comprehensive historical financial statements and pre-filled forecasts for PayPoint plc (PAYL).
- Fully Adjustable Inputs: Customize WACC, tax rates, revenue growth, and EBITDA margins as needed.
- Instant Results: Watch the intrinsic value of PayPoint plc (PAYL) recalibrate in real time.
- Clear Visual Outputs: Dashboard charts vividly illustrate valuation outcomes and essential metrics.
- Built for Accuracy: A professional-grade tool tailored for analysts, investors, and finance professionals.
How It Functions
- 1. Access the Template: Download and open the Excel file containing PayPoint plc’s (PAYL) preloaded data.
- 2. Modify Assumptions: Adjust essential inputs such as growth rates, WACC, and capital expenditures.
- 3. Instantly View Results: The DCF model automatically computes intrinsic value and NPV in real time.
- 4. Experiment with Scenarios: Analyze different valuation outcomes by comparing multiple forecasts.
- 5. Utilize with Assurance: Deliver professional valuation insights to inform your decision-making process.
Why Choose This Calculator for PayPoint plc (PAYL)?
- User-Friendly Interface: Tailored for both novices and seasoned professionals.
- Customizable Inputs: Adjust parameters effortlessly to suit your analysis needs.
- Real-Time Feedback: Witness immediate updates to PayPoint's valuation as you change the inputs.
- Pre-Configured Data: Comes loaded with PayPoint's actual financial metrics for swift evaluations.
- Relied Upon by Experts: Favored by investors and analysts for making well-informed choices.
Who Can Benefit from PayPoint plc (PAYL)?
- Finance Students: Explore valuation methods and apply them with actual market data.
- Researchers: Integrate industry-standard models into your studies and analyses.
- Investors: Validate your investment hypotheses and evaluate valuation results for PayPoint plc (PAYL).
- Financial Analysts: Optimize your analysis process using a ready-to-use, customizable DCF model.
- Entrepreneurs: Understand the evaluation approaches used for major public entities like PayPoint plc (PAYL).
Contents of the Template
- Preloaded PAYL Data: Historical and forecasted financial information, encompassing revenue, EBIT, and capital expenditures.
- DCF and WACC Models: Advanced spreadsheets designed for calculating intrinsic value and Weighted Average Cost of Capital.
- Editable Inputs: Yellow-highlighted cells for modifying revenue growth, tax rates, and discount rates.
- Financial Statements: Detailed annual and quarterly financial reports for in-depth analysis.
- Key Ratios: Profitability, leverage, and efficiency ratios to assess performance.
- Dashboard and Charts: Visual representations of valuation results and underlying assumptions.
Disclaimer
All information, articles, and product details provided on this website are for general informational and educational purposes only. We do not claim any ownership over, nor do we intend to infringe upon, any trademarks, copyrights, logos, brand names, or other intellectual property mentioned or depicted on this site. Such intellectual property remains the property of its respective owners, and any references here are made solely for identification or informational purposes, without implying any affiliation, endorsement, or partnership.
We make no representations or warranties, express or implied, regarding the accuracy, completeness, or suitability of any content or products presented. Nothing on this website should be construed as legal, tax, investment, financial, medical, or other professional advice. In addition, no part of this site—including articles or product references—constitutes a solicitation, recommendation, endorsement, advertisement, or offer to buy or sell any securities, franchises, or other financial instruments, particularly in jurisdictions where such activity would be unlawful.
All content is of a general nature and may not address the specific circumstances of any individual or entity. It is not a substitute for professional advice or services. Any actions you take based on the information provided here are strictly at your own risk. You accept full responsibility for any decisions or outcomes arising from your use of this website and agree to release us from any liability in connection with your use of, or reliance upon, the content or products found herein.