
|
Avaliação DCF PacCar Inc (PCAR) |
Totalmente Editável: Adapte-Se Às Suas Necessidades No Excel Ou Planilhas
Design Profissional: Modelos Confiáveis E Padrão Da Indústria
Pré-Construídos Para Uso Rápido E Eficiente
Compatível com MAC/PC, totalmente desbloqueado
Não É Necessária Experiência; Fácil De Seguir
PACCAR Inc (PCAR) Bundle
Revelar o verdadeiro potencial do PacCar Inc (PCAR) com nossa calculadora DCF avançada! Ajuste as principais suposições, explore vários cenários e avalie como diferentes alterações afetam a avaliação da Paccar Inc (PCAR) - tudo dentro de um único modelo do Excel.
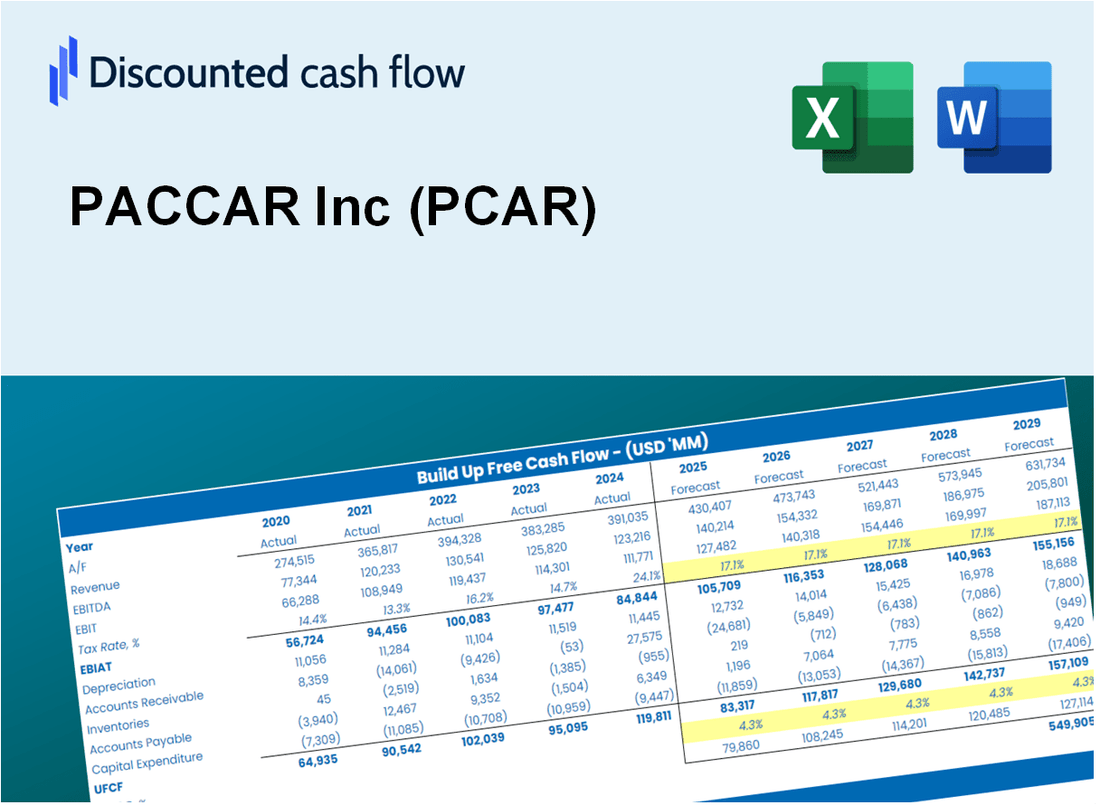
Discounted Cash Flow (DCF) - (USD MM)
| Year | AY1 2020 |
AY2 2021 |
AY3 2022 |
AY4 2023 |
AY5 2024 |
FY1 2025 |
FY2 2026 |
FY3 2027 |
FY4 2028 |
FY5 2029 |
|---|---|---|---|---|---|---|---|---|---|---|
| Revenue | 18,724.5 | 23,538.9 | 28,839.0 | 35,159.3 | 33,651.7 | 39,192.1 | 45,644.7 | 53,159.7 | 61,911.9 | 72,105.0 |
| Revenue Growth, % | 0 | 25.71 | 22.52 | 21.92 | -4.29 | 16.46 | 16.46 | 16.46 | 16.46 | 16.46 |
| EBITDA | 2,557.9 | 3,268.2 | 4,647.9 | 6,626.9 | 6,348.9 | 6,378.6 | 7,428.8 | 8,651.9 | 10,076.3 | 11,735.3 |
| EBITDA, % | 13.66 | 13.88 | 16.12 | 18.85 | 18.87 | 16.28 | 16.28 | 16.28 | 16.28 | 16.28 |
| Depreciation | 901.5 | 867.8 | 807.1 | 903.6 | 916.9 | 1,300.8 | 1,514.9 | 1,764.3 | 2,054.8 | 2,393.1 |
| Depreciation, % | 4.81 | 3.69 | 2.8 | 2.57 | 2.72 | 3.32 | 3.32 | 3.32 | 3.32 | 3.32 |
| EBIT | 1,656.4 | 2,400.4 | 3,840.8 | 5,723.3 | 5,432.0 | 5,077.9 | 5,913.9 | 6,887.6 | 8,021.5 | 9,342.2 |
| EBIT, % | 8.85 | 10.2 | 13.32 | 16.28 | 16.14 | 12.96 | 12.96 | 12.96 | 12.96 | 12.96 |
| Total Cash | 4,968.6 | 4,987.7 | 6,305.1 | 9,004.3 | 9,839.6 | 9,753.9 | 11,359.8 | 13,230.1 | 15,408.3 | 17,945.1 |
| Total Cash, percent | .0 | .0 | .0 | .0 | .0 | .0 | .0 | .0 | .0 | .0 |
| Account Receivables | 13,018.2 | 13,495.9 | 15,711.7 | 19,769.8 | 21,248.1 | 23,571.0 | 27,451.7 | 31,971.3 | 37,235.1 | 43,365.5 |
| Account Receivables, % | 69.52 | 57.33 | 54.48 | 56.23 | 63.14 | 60.14 | 60.14 | 60.14 | 60.14 | 60.14 |
| Inventories | 1,221.9 | 1,976.0 | 2,198.8 | 2,576.7 | 2,367.1 | 2,893.0 | 3,369.3 | 3,924.0 | 4,570.0 | 5,322.4 |
| Inventories, % | 6.53 | 8.39 | 7.62 | 7.33 | 7.03 | 7.38 | 7.38 | 7.38 | 7.38 | 7.38 |
| Accounts Payable | 1,737.2 | 2,018.0 | 2,491.9 | 2,659.9 | 2,705.1 | 3,299.6 | 3,842.9 | 4,475.5 | 5,212.4 | 6,070.6 |
| Accounts Payable, % | 9.28 | 8.57 | 8.64 | 7.57 | 8.04 | 8.42 | 8.42 | 8.42 | 8.42 | 8.42 |
| Capital Expenditure | -1,638.4 | -1,632.8 | -1,390.5 | -1,262.5 | -1,745.6 | -2,295.6 | -2,673.5 | -3,113.7 | -3,626.3 | -4,223.4 |
| Capital Expenditure, % | -8.75 | -6.94 | -4.82 | -3.59 | -5.19 | -5.86 | -5.86 | -5.86 | -5.86 | -5.86 |
| Tax Rate, % | 22.94 | 22.94 | 22.94 | 22.94 | 22.94 | 22.94 | 22.94 | 22.94 | 22.94 | 22.94 |
| EBITAT | 1,300.0 | 1,868.7 | 3,005.4 | 4,604.9 | 4,186.0 | 3,982.1 | 4,637.7 | 5,401.3 | 6,290.5 | 7,326.2 |
| Depreciation | ||||||||||
| Changes in Account Receivables | ||||||||||
| Changes in Inventories | ||||||||||
| Changes in Accounts Payable | ||||||||||
| Capital Expenditure | ||||||||||
| UFCF | -11,939.8 | 152.7 | 457.3 | -22.0 | 2,133.8 | 733.1 | -334.7 | -389.8 | -453.9 | -528.7 |
| WACC, % | 7.22 | 7.21 | 7.21 | 7.23 | 7.2 | 7.22 | 7.22 | 7.22 | 7.22 | 7.22 |
| PV UFCF | ||||||||||
| SUM PV UFCF | -640.4 | |||||||||
| Long Term Growth Rate, % | 2.00 | |||||||||
| Free cash flow (T + 1) | -539 | |||||||||
| Terminal Value | -10,338 | |||||||||
| Present Terminal Value | -7,297 | |||||||||
| Enterprise Value | -7,937 | |||||||||
| Net Debt | 8,834 | |||||||||
| Equity Value | -16,772 | |||||||||
| Diluted Shares Outstanding, MM | 527 | |||||||||
| Equity Value Per Share | -31.85 |
What You Will Get
- Pre-Filled Financial Model: PACCAR Inc's (PCAR) actual data allows for accurate DCF valuation.
- Full Forecast Control: Modify revenue growth, profit margins, WACC, and other essential drivers.
- Instant Calculations: Real-time updates ensure you see outcomes as you make adjustments.
- Investor-Ready Template: A polished Excel file tailored for high-quality valuation.
- Customizable and Reusable: Designed for versatility, enabling repeated use for comprehensive forecasts.
Key Features
- Real-Life PCAR Data: Pre-filled with PACCAR Inc’s historical financials and future projections.
- Fully Customizable Inputs: Adjust revenue growth, profit margins, WACC, tax rates, and capital expenditures.
- Dynamic Valuation Model: Automatic updates to Net Present Value (NPV) and intrinsic value based on your inputs.
- Scenario Testing: Create multiple forecast scenarios to analyze various valuation outcomes.
- User-Friendly Design: Simple, structured, and designed for both professionals and beginners.
How It Works
- Step 1: Download the prebuilt Excel template featuring PACCAR Inc's (PCAR) data.
- Step 2: Navigate through the pre-filled sheets to familiarize yourself with the essential metrics.
- Step 3: Modify forecasts and assumptions in the editable yellow cells (WACC, growth, margins).
- Step 4: Instantly see recalculated results, including PACCAR Inc's (PCAR) intrinsic value.
- Step 5: Make well-informed investment decisions or create reports using the generated outputs.
Why Choose This Calculator for PACCAR Inc (PCAR)?
- User-Friendly Interface: Tailored for both novice and seasoned users.
- Customizable Inputs: Adjust parameters effortlessly to suit your financial analysis.
- Real-Time Feedback: Watch PACCAR's valuation update instantly as you tweak the inputs.
- Preloaded Data: Comes equipped with PACCAR's latest financial metrics for swift evaluations.
- Relied Upon by Experts: Favored by investors and analysts for making well-informed choices.
Who Should Use This Product?
- Individual Investors: Make informed decisions about buying or selling PACCAR Inc (PCAR) stock.
- Financial Analysts: Streamline valuation processes with ready-to-use financial models for PACCAR Inc (PCAR).
- Consultants: Deliver professional valuation insights on PACCAR Inc (PCAR) to clients quickly and accurately.
- Business Owners: Understand how major companies like PACCAR Inc (PCAR) are valued to guide your own business strategy.
- Finance Students: Learn valuation techniques using real-world data and scenarios related to PACCAR Inc (PCAR).
What the Template Contains
- Comprehensive DCF Model: Editable template featuring detailed valuation calculations.
- Real-World Data: PACCAR Inc’s (PCAR) historical and projected financials preloaded for analysis.
- Customizable Parameters: Adjust WACC, growth rates, and tax assumptions to explore various scenarios.
- Financial Statements: Complete annual and quarterly breakdowns for in-depth insights.
- Key Ratios: Integrated analysis for profitability, efficiency, and leverage metrics.
- Dashboard with Visual Outputs: Charts and tables designed for clear, actionable results.
Disclaimer
All information, articles, and product details provided on this website are for general informational and educational purposes only. We do not claim any ownership over, nor do we intend to infringe upon, any trademarks, copyrights, logos, brand names, or other intellectual property mentioned or depicted on this site. Such intellectual property remains the property of its respective owners, and any references here are made solely for identification or informational purposes, without implying any affiliation, endorsement, or partnership.
We make no representations or warranties, express or implied, regarding the accuracy, completeness, or suitability of any content or products presented. Nothing on this website should be construed as legal, tax, investment, financial, medical, or other professional advice. In addition, no part of this site—including articles or product references—constitutes a solicitation, recommendation, endorsement, advertisement, or offer to buy or sell any securities, franchises, or other financial instruments, particularly in jurisdictions where such activity would be unlawful.
All content is of a general nature and may not address the specific circumstances of any individual or entity. It is not a substitute for professional advice or services. Any actions you take based on the information provided here are strictly at your own risk. You accept full responsibility for any decisions or outcomes arising from your use of this website and agree to release us from any liability in connection with your use of, or reliance upon, the content or products found herein.