
|
Avaliação DCF da Pacific Gas and Electric Company (PCG-PE) |
Totalmente Editável: Adapte-Se Às Suas Necessidades No Excel Ou Planilhas
Design Profissional: Modelos Confiáveis E Padrão Da Indústria
Pré-Construídos Para Uso Rápido E Eficiente
Compatível com MAC/PC, totalmente desbloqueado
Não É Necessária Experiência; Fácil De Seguir
Pacific Gas and Electric Company (PCG-PE) Bundle
Interessado em estimar o valor intrínseco da Pacific Gas and Electric Company? Nossa calculadora PCG-PE DCF integra dados do mundo real com recursos abrangentes de personalização, permitindo refinar as previsões e aprimorar suas decisões de investimento.
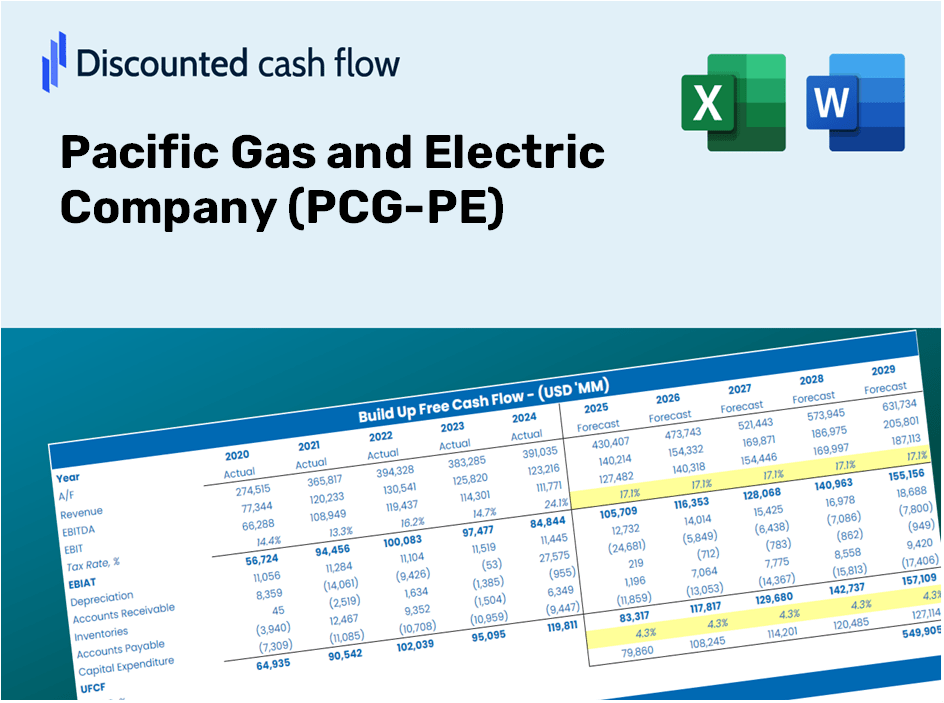
Discounted Cash Flow (DCF) - (USD MM)
| Year | AY1 2020 |
AY2 2021 |
AY3 2022 |
AY4 2023 |
AY5 2024 |
FY1 2025 |
FY2 2026 |
FY3 2027 |
FY4 2028 |
FY5 2029 |
|---|---|---|---|---|---|---|---|---|---|---|
| Revenue | 18,469.0 | 20,642.0 | 21,680.0 | 24,428.0 | 24,419.0 | 26,215.8 | 28,144.8 | 30,215.7 | 32,439.1 | 34,826.0 |
| Revenue Growth, % | 0 | 11.77 | 5.03 | 12.68 | -0.03684297 | 7.36 | 7.36 | 7.36 | 7.36 | 7.36 |
| EBITDA | 4,199.0 | 6,269.0 | 6,726.0 | 7,854.0 | 9,935.0 | 8,230.0 | 8,835.6 | 9,485.7 | 10,183.7 | 10,933.0 |
| EBITDA, % | 22.74 | 30.37 | 31.02 | 32.15 | 40.69 | 31.39 | 31.39 | 31.39 | 31.39 | 31.39 |
| Depreciation | 3,881.0 | 3,920.0 | 4,333.0 | 4,305.0 | 4,572.0 | 5,051.1 | 5,422.7 | 5,821.8 | 6,250.1 | 6,710.0 |
| Depreciation, % | 21.01 | 18.99 | 19.99 | 17.62 | 18.72 | 19.27 | 19.27 | 19.27 | 19.27 | 19.27 |
| EBIT | 318.0 | 2,349.0 | 2,393.0 | 3,549.0 | 5,363.0 | 3,178.9 | 3,412.8 | 3,664.0 | 3,933.6 | 4,223.0 |
| EBIT, % | 1.72 | 11.38 | 11.04 | 14.53 | 21.96 | 12.13 | 12.13 | 12.13 | 12.13 | 12.13 |
| Total Cash | 484.0 | 291.0 | 734.0 | 635.0 | 940.0 | 727.0 | 780.4 | 837.9 | 899.5 | 965.7 |
| Total Cash, percent | .0 | .0 | .0 | .0 | .0 | .0 | .0 | .0 | .0 | .0 |
| Account Receivables | 6,139.0 | 8,335.0 | 8,837.0 | 10,456.0 | 12,744.0 | 10,977.7 | 11,785.4 | 12,652.6 | 13,583.6 | 14,583.1 |
| Account Receivables, % | 33.24 | 40.38 | 40.76 | 42.8 | 52.19 | 41.87 | 41.87 | 41.87 | 41.87 | 41.87 |
| Inventories | 628.0 | 596.0 | 842.0 | 870.0 | 820.0 | 896.1 | 962.0 | 1,032.8 | 1,108.8 | 1,190.4 |
| Inventories, % | 3.4 | 2.89 | 3.88 | 3.56 | 3.36 | 3.42 | 3.42 | 3.42 | 3.42 | 3.42 |
| Accounts Payable | 2,402.0 | 2,855.0 | 2,888.0 | 2,309.0 | 2,748.0 | 3,191.2 | 3,426.0 | 3,678.1 | 3,948.7 | 4,239.3 |
| Accounts Payable, % | 13.01 | 13.83 | 13.32 | 9.45 | 11.25 | 12.17 | 12.17 | 12.17 | 12.17 | 12.17 |
| Capital Expenditure | -7,690.0 | -7,689.0 | -9,584.0 | -9,714.0 | -10,369.0 | -10,765.4 | -11,557.5 | -12,407.9 | -13,320.9 | -14,301.1 |
| Capital Expenditure, % | -41.64 | -37.25 | -44.21 | -39.77 | -42.46 | -41.06 | -41.06 | -41.06 | -41.06 | -41.06 |
| Tax Rate, % | -8.65 | -8.65 | -8.65 | -8.65 | -8.65 | -8.65 | -8.65 | -8.65 | -8.65 | -8.65 |
| EBITAT | 440.2 | -276.4 | 9,119.5 | 11,454.3 | 5,826.9 | 2,543.1 | 2,730.3 | 2,931.2 | 3,146.9 | 3,378.4 |
| Depreciation | ||||||||||
| Changes in Account Receivables | ||||||||||
| Changes in Inventories | ||||||||||
| Changes in Accounts Payable | ||||||||||
| Capital Expenditure | ||||||||||
| UFCF | -7,733.8 | -5,756.4 | 3,153.5 | 3,819.3 | -1,769.1 | -1,037.8 | -4,043.4 | -4,340.9 | -4,660.3 | -5,003.2 |
| WACC, % | 5.68 | 2.39 | 5.68 | 5.68 | 5.68 | 5.02 | 5.02 | 5.02 | 5.02 | 5.02 |
| PV UFCF | ||||||||||
| SUM PV UFCF | -16,148.7 | |||||||||
| Long Term Growth Rate, % | 3.80 | |||||||||
| Free cash flow (T + 1) | -5,193 | |||||||||
| Terminal Value | -425,243 | |||||||||
| Present Terminal Value | -332,852 | |||||||||
| Enterprise Value | -349,000 | |||||||||
| Net Debt | 57,403 | |||||||||
| Equity Value | -406,403 | |||||||||
| Diluted Shares Outstanding, MM | 2,147 | |||||||||
| Equity Value Per Share | -189.29 |
Benefits You Will Receive
- Authentic PG&E Data: Preloaded financial information – including revenue and EBIT – sourced from actual and projected metrics.
- Comprehensive Customization: Modify all essential parameters (yellow cells) such as WACC, growth %, and tax rates to fit your analysis.
- Real-Time Valuation Updates: Automatic recalibrations to assess the effects of any changes on PG&E’s fair value.
- Flexible Excel Template: Designed for easy modifications, scenario analysis, and precise forecasting.
- Efficient and Reliable: Eliminate the need to build models from the ground up while ensuring accuracy and adaptability.
Key Features
- Authentic PG&E Financials: Gain access to reliable pre-loaded historical data and future forecasts.
- Adjustable Forecast Parameters: Modify the yellow-highlighted fields including WACC, growth rates, and profit margins.
- Real-Time Calculations: Automatic updates for DCF, Net Present Value (NPV), and cash flow assessments.
- User-Friendly Dashboard: Clear charts and summaries to help you visualize your valuation outcomes.
- Designed for All Skill Levels: An intuitive interface suitable for investors, CFOs, and consultants alike.
How It Functions
- Download the Template: Gain immediate access to the Excel-based PCG-PE DCF Calculator.
- Input Your Assumptions: Modify the yellow-highlighted cells for growth rates, WACC, margins, and other factors.
- Instant Calculations: The model automatically updates the intrinsic value of Pacific Gas and Electric Company.
- Test Scenarios: Experiment with various assumptions to assess potential changes in valuation.
- Analyze and Decide: Utilize the results to inform your investment or financial analysis.
Why Choose This Calculator for Pacific Gas and Electric Company (PCG-PE)?
- Time-Saving: No need to build a DCF model from the ground up – it's ready for immediate use.
- Enhanced Accuracy: Dependable financial data and formulas minimize valuation errors.
- Fully Customizable: Adjust the model to align with your specific assumptions and forecasts.
- User-Friendly: Intuitive charts and outputs simplify result analysis.
- Expert Approved: Created for professionals who prioritize both precision and ease of use.
Who Can Benefit from This Product?
- Investors: Assess Pacific Gas and Electric Company’s valuation before making stock decisions.
- CFOs and Financial Analysts: Enhance valuation procedures and evaluate financial forecasts.
- Startup Founders: Understand the valuation methods used for large utilities like Pacific Gas and Electric Company.
- Consultants: Create comprehensive valuation reports for your clientele.
- Students and Educators: Utilize authentic data to learn and teach valuation methodologies.
Contents of the Template
- Historical Data: Features past financial performance and baseline forecasts for Pacific Gas and Electric Company (PCG-PE).
- DCF and Levered DCF Models: Comprehensive templates for calculating the intrinsic value of Pacific Gas and Electric Company (PCG-PE).
- WACC Sheet: Pre-configured calculations for the Weighted Average Cost of Capital tailored to Pacific Gas and Electric Company (PCG-PE).
- Editable Inputs: Adjust key variables such as growth rates, EBITDA %, and CAPEX assumptions.
- Quarterly and Annual Statements: An extensive overview of the financials for Pacific Gas and Electric Company (PCG-PE).
- Interactive Dashboard: A dynamic interface to visualize valuation results and future projections.
Disclaimer
All information, articles, and product details provided on this website are for general informational and educational purposes only. We do not claim any ownership over, nor do we intend to infringe upon, any trademarks, copyrights, logos, brand names, or other intellectual property mentioned or depicted on this site. Such intellectual property remains the property of its respective owners, and any references here are made solely for identification or informational purposes, without implying any affiliation, endorsement, or partnership.
We make no representations or warranties, express or implied, regarding the accuracy, completeness, or suitability of any content or products presented. Nothing on this website should be construed as legal, tax, investment, financial, medical, or other professional advice. In addition, no part of this site—including articles or product references—constitutes a solicitation, recommendation, endorsement, advertisement, or offer to buy or sell any securities, franchises, or other financial instruments, particularly in jurisdictions where such activity would be unlawful.
All content is of a general nature and may not address the specific circumstances of any individual or entity. It is not a substitute for professional advice or services. Any actions you take based on the information provided here are strictly at your own risk. You accept full responsibility for any decisions or outcomes arising from your use of this website and agree to release us from any liability in connection with your use of, or reliance upon, the content or products found herein.