
|
Processa Pharmaceuticals, Inc. (PCSA) Avaliação DCF |
Totalmente Editável: Adapte-Se Às Suas Necessidades No Excel Ou Planilhas
Design Profissional: Modelos Confiáveis E Padrão Da Indústria
Pré-Construídos Para Uso Rápido E Eficiente
Compatível com MAC/PC, totalmente desbloqueado
Não É Necessária Experiência; Fácil De Seguir
Processa Pharmaceuticals, Inc. (PCSA) Bundle
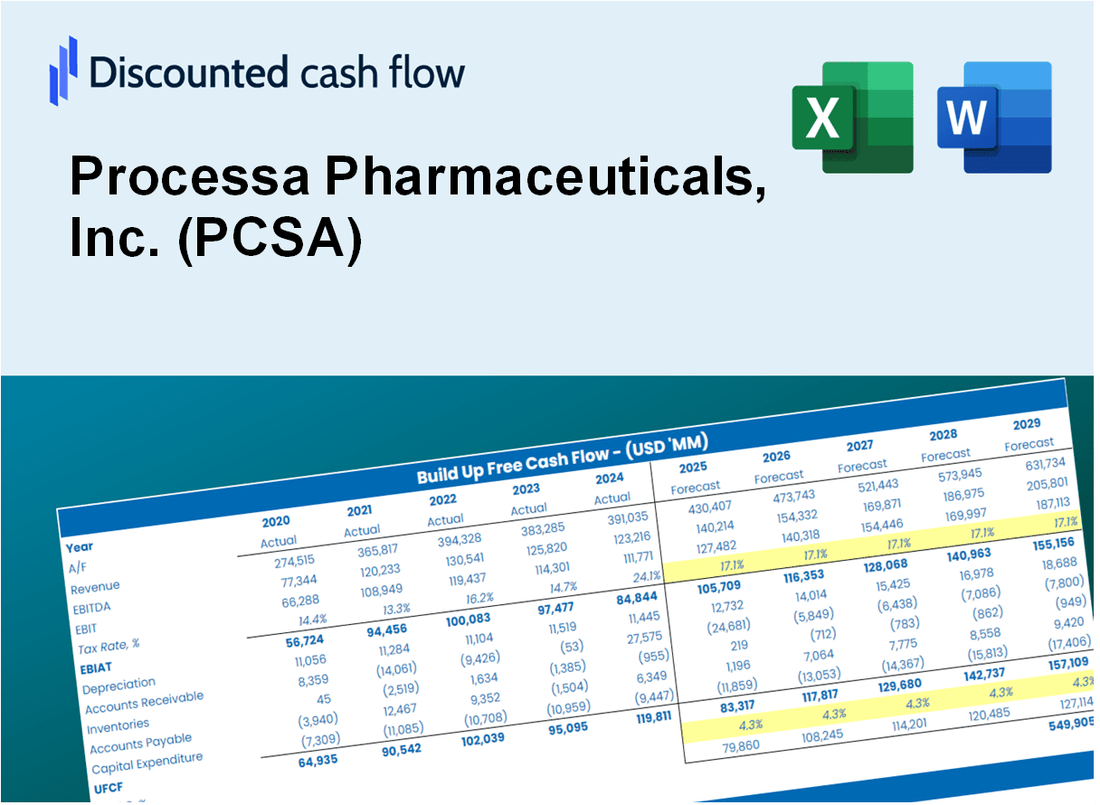
Projetado para precisão, a nossa calculadora DCF (PCSA) capacita você a avaliar a avaliação da Processa Pharmaceuticals, Inc. usando dados financeiros reais, oferecendo flexibilidade completa para modificar todos os parâmetros essenciais para projeções aprimoradas.
Discounted Cash Flow (DCF) - (USD MM)
| Year | AY1 2020 |
AY2 2021 |
AY3 2022 |
AY4 2023 |
AY5 2024 |
FY1 2025 |
FY2 2026 |
FY3 2027 |
FY4 2028 |
FY5 2029 |
|---|---|---|---|---|---|---|---|---|---|---|
| Revenue | .0 | .0 | .0 | .0 | .0 | .0 | .0 | .0 | .0 | .0 |
| Revenue Growth, % | 0 | 0 | 0 | 0 | 0 | 0 | 0 | 0 | 0 | 0 |
| EBITDA | -14.3 | -10.8 | -19.5 | -11.5 | -12.1 | .0 | .0 | .0 | .0 | .0 |
| EBITDA, % | 100 | 100 | 100 | 100 | 100 | 100 | 100 | 100 | 100 | 100 |
| Depreciation | .9 | .8 | .8 | .0 | .0 | .0 | .0 | .0 | .0 | .0 |
| Depreciation, % | 100 | 100 | 100 | 100 | 100 | 100 | 100 | 100 | 100 | 100 |
| EBIT | -15.1 | -11.6 | -20.3 | -11.5 | -12.1 | .0 | .0 | .0 | .0 | .0 |
| EBIT, % | 100 | 100 | 100 | 100 | 100 | 100 | 100 | 100 | 100 | 100 |
| Total Cash | 15.4 | 16.5 | 6.5 | 4.7 | 1.2 | .0 | .0 | .0 | .0 | .0 |
| Total Cash, percent | .0 | .0 | .0 | .0 | .0 | .0 | .0 | .0 | .0 | .0 |
| Account Receivables | .2 | .1 | .0 | .0 | .0 | .0 | .0 | .0 | .0 | .0 |
| Account Receivables, % | 100 | 100 | 100 | 100 | 100 | 100 | 100 | 100 | 100 | 100 |
| Inventories | .0 | .0 | .0 | .0 | .0 | .0 | .0 | .0 | .0 | .0 |
| Inventories, % | 100 | 100 | 100 | 100 | 100 | 100 | 100 | 100 | 100 | 100 |
| Accounts Payable | .3 | .2 | .3 | .3 | .9 | .0 | .0 | .0 | .0 | .0 |
| Accounts Payable, % | 100 | 100 | 100 | 100 | 100 | 100 | 100 | 100 | 100 | 100 |
| Capital Expenditure | .0 | .0 | .0 | .0 | .0 | .0 | .0 | .0 | .0 | .0 |
| Capital Expenditure, % | 100 | 100 | 100 | 100 | 100 | 0 | 0 | 0 | 0 | 0 |
| Tax Rate, % | 0 | 0 | 0 | 0 | 0 | 0 | 0 | 0 | 0 | 0 |
| EBITAT | -18.7 | -11.1 | -20.3 | -11.5 | -12.1 | .0 | .0 | .0 | .0 | .0 |
| Depreciation | ||||||||||
| Changes in Account Receivables | ||||||||||
| Changes in Inventories | ||||||||||
| Changes in Accounts Payable | ||||||||||
| Capital Expenditure | ||||||||||
| UFCF | -17.7 | -10.2 | -19.3 | -11.5 | -11.5 | -.9 | .0 | .0 | .0 | .0 |
| WACC, % | 8.41 | 8.4 | 8.41 | 8.41 | 8.41 | 8.41 | 8.41 | 8.41 | 8.41 | 8.41 |
| PV UFCF | ||||||||||
| SUM PV UFCF | -.8 | |||||||||
| Long Term Growth Rate, % | 2.00 | |||||||||
| Free cash flow (T + 1) | 0 | |||||||||
| Terminal Value | 0 | |||||||||
| Present Terminal Value | 0 | |||||||||
| Enterprise Value | -1 | |||||||||
| Net Debt | -1 | |||||||||
| Equity Value | 0 | |||||||||
| Diluted Shares Outstanding, MM | 3 | |||||||||
| Equity Value Per Share | 0.10 |
What You Will Receive
- Pre-Filled Financial Model: Processa Pharmaceuticals' actual data allows for accurate DCF valuation.
- Comprehensive Forecast Control: Modify revenue growth, profit margins, WACC, and other essential factors.
- Real-Time Calculations: Automatic updates provide instant feedback as you adjust inputs.
- Investor-Ready Template: A polished Excel file crafted for high-quality valuation presentations.
- Customizable and Reusable: Designed for versatility, enabling ongoing use for in-depth forecasts.
Key Features
- Customizable Clinical Parameters: Adjust essential inputs such as patient demographics, treatment efficacy, and cost projections.
- Instant DCF Valuation: Quickly computes intrinsic value, NPV, and additional metrics with ease.
- High-Precision Accuracy: Utilizes real-world financial data from Processa Pharmaceuticals for dependable valuation results.
- Effortless Scenario Analysis: Evaluate various assumptions and effortlessly compare results.
- Efficiency Booster: Remove the complexity of developing detailed valuation models from the ground up.
How It Works
- Download the Template: Gain immediate access to the Excel-based PCSA DCF Calculator.
- Input Your Assumptions: Modify the yellow-highlighted cells for growth rates, WACC, margins, and other variables.
- Instant Calculations: The model automatically calculates Processa Pharmaceuticals’ intrinsic value.
- Test Scenarios: Experiment with different assumptions to see how they affect the valuation.
- Analyze and Decide: Utilize the output to inform your investment or financial strategy.
Why Choose This Calculator for Processa Pharmaceuticals, Inc. (PCSA)?
- Accurate Data: Utilize real financial metrics from Processa Pharmaceuticals for dependable valuation outcomes.
- Customizable: Tailor critical inputs such as growth projections, WACC, and tax rates to align with your expectations.
- Time-Saving: Ready-to-use calculations streamline your analysis process.
- Professional-Grade Tool: Crafted for investors, analysts, and industry consultants.
- User-Friendly: Designed with an intuitive interface and clear instructions to accommodate users of all levels.
Who Should Use Processa Pharmaceuticals, Inc. (PCSA)?
- Investors: Gain insights into the pharmaceutical market with a reliable investment analysis tool.
- Financial Analysts: Streamline your workflow with a comprehensive model tailored for pharmaceutical evaluations.
- Consultants: Effortlessly modify the framework for client discussions or industry reports.
- Pharmaceutical Enthusiasts: Enhance your knowledge of drug development processes and market dynamics through practical examples.
- Educators and Students: Utilize it as a hands-on resource in courses related to pharmaceuticals and finance.
What the Template Contains
- Comprehensive DCF Model: Editable template featuring intricate valuation calculations tailored for Processa Pharmaceuticals, Inc. (PCSA).
- Real-World Data: Historical and projected financials for Processa Pharmaceuticals preloaded for in-depth analysis.
- Customizable Parameters: Modify WACC, growth rates, and tax assumptions to explore various scenarios.
- Financial Statements: Complete annual and quarterly breakdowns to provide deeper insights into financial performance.
- Key Ratios: Integrated analysis for assessing profitability, efficiency, and leverage specific to Processa Pharmaceuticals.
- Dashboard with Visual Outputs: Charts and tables designed for clear and actionable results.
Disclaimer
All information, articles, and product details provided on this website are for general informational and educational purposes only. We do not claim any ownership over, nor do we intend to infringe upon, any trademarks, copyrights, logos, brand names, or other intellectual property mentioned or depicted on this site. Such intellectual property remains the property of its respective owners, and any references here are made solely for identification or informational purposes, without implying any affiliation, endorsement, or partnership.
We make no representations or warranties, express or implied, regarding the accuracy, completeness, or suitability of any content or products presented. Nothing on this website should be construed as legal, tax, investment, financial, medical, or other professional advice. In addition, no part of this site—including articles or product references—constitutes a solicitation, recommendation, endorsement, advertisement, or offer to buy or sell any securities, franchises, or other financial instruments, particularly in jurisdictions where such activity would be unlawful.
All content is of a general nature and may not address the specific circumstances of any individual or entity. It is not a substitute for professional advice or services. Any actions you take based on the information provided here are strictly at your own risk. You accept full responsibility for any decisions or outcomes arising from your use of this website and agree to release us from any liability in connection with your use of, or reliance upon, the content or products found herein.