
|
Avaliação Pure Cycle Corporation (PCYO) DCF |
Totalmente Editável: Adapte-Se Às Suas Necessidades No Excel Ou Planilhas
Design Profissional: Modelos Confiáveis E Padrão Da Indústria
Pré-Construídos Para Uso Rápido E Eficiente
Compatível com MAC/PC, totalmente desbloqueado
Não É Necessária Experiência; Fácil De Seguir
Pure Cycle Corporation (PCYO) Bundle
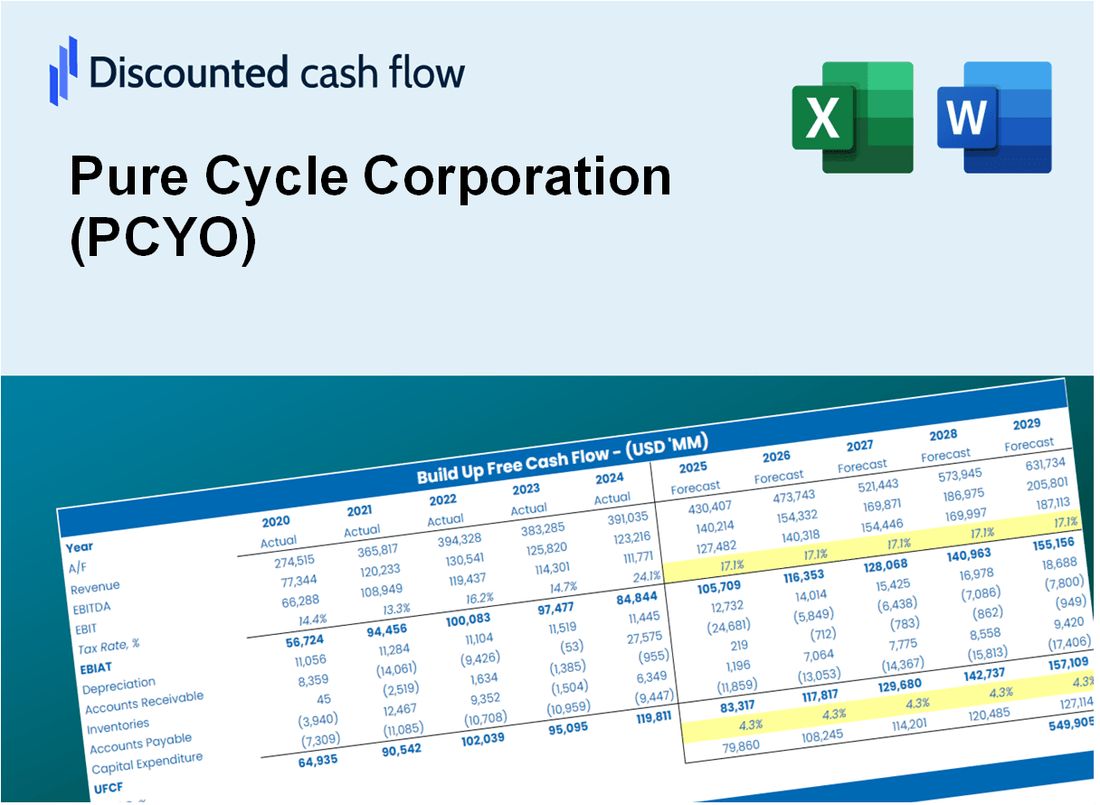
Simplifique a avaliação da Pure Cycle Corporation (PCYO) com esta calculadora DCF personalizável! Com o Real Pure Cycle Corporation (PCYO) e os insumos de previsão ajustável, você pode testar cenários e descobrir valor justo da Pure Cycle Corporation (PCYO) em minutos.
Discounted Cash Flow (DCF) - (USD MM)
| Year | AY1 2021 |
AY2 2022 |
AY3 2023 |
AY4 2024 |
AY5 2025 |
FY1 2026 |
FY2 2027 |
FY3 2028 |
FY4 2029 |
FY5 2030 |
|---|---|---|---|---|---|---|---|---|---|---|
| Revenue | 17.1 | 23.0 | 14.6 | 28.7 | 26.1 | 31.7 | 38.4 | 46.7 | 56.6 | 68.8 |
| Revenue Growth, % | 0 | 34.32 | -36.59 | 97.09 | -9.25 | 21.39 | 21.39 | 21.39 | 21.39 | 21.39 |
| EBITDA | 28.4 | 14.9 | 8.6 | 18.2 | 20.2 | 23.1 | 28.0 | 34.0 | 41.3 | 50.1 |
| EBITDA, % | 165.62 | 64.86 | 58.84 | 63.21 | 77.41 | 72.86 | 72.86 | 72.86 | 72.86 | 72.86 |
| Depreciation | 1.8 | 2.1 | 2.2 | 2.1 | 2.3 | 3.2 | 3.9 | 4.7 | 5.7 | 6.9 |
| Depreciation, % | 10.35 | 9.24 | 14.78 | 7.31 | 8.81 | 10.1 | 10.1 | 10.1 | 10.1 | 10.1 |
| EBIT | 26.6 | 12.8 | 6.4 | 16.1 | 17.9 | 20.5 | 24.9 | 30.3 | 36.7 | 44.6 |
| EBIT, % | 155.27 | 55.62 | 44.06 | 55.9 | 68.6 | 64.84 | 64.84 | 64.84 | 64.84 | 64.84 |
| Total Cash | 20.1 | 34.9 | 26.0 | 22.1 | 21.9 | 29.2 | 35.4 | 43.0 | 52.2 | 63.4 |
| Total Cash, percent | .0 | .0 | .0 | .0 | .0 | .0 | .0 | .0 | .0 | .0 |
| Account Receivables | 17.5 | 2.4 | 1.6 | 1.5 | 1.3 | 8.4 | 10.2 | 12.3 | 15.0 | 18.2 |
| Account Receivables, % | 102.38 | 10.54 | 11.26 | 5.12 | 5.1 | 26.41 | 26.41 | 26.41 | 26.41 | 26.41 |
| Inventories | .6 | .0 | 1.7 | 3.6 | 7.4 | 3.6 | 4.3 | 5.3 | 6.4 | 7.8 |
| Inventories, % | 3.55 | 0 | 11.83 | 12.69 | 28.32 | 11.28 | 11.28 | 11.28 | 11.28 | 11.28 |
| Accounts Payable | 1.8 | .8 | 2.0 | 1.9 | 3.5 | 3.0 | 3.7 | 4.5 | 5.4 | 6.6 |
| Accounts Payable, % | 10.44 | 3.69 | 13.44 | 6.78 | 13.49 | 9.57 | 9.57 | 9.57 | 9.57 | 9.57 |
| Capital Expenditure | -2.9 | -5.7 | -7.8 | -2.7 | -9.5 | -8.9 | -10.8 | -13.1 | -15.9 | -19.4 |
| Capital Expenditure, % | -16.91 | -24.68 | -53.55 | -9.3 | -36.31 | -28.15 | -28.15 | -28.15 | -28.15 | -28.15 |
| Tax Rate, % | 24.96 | 24.96 | 24.96 | 24.96 | 24.96 | 24.96 | 24.96 | 24.96 | 24.96 | 24.96 |
| EBITAT | 20.1 | 9.7 | 4.9 | 11.9 | 13.4 | 15.4 | 18.8 | 22.8 | 27.6 | 33.5 |
| Depreciation | ||||||||||
| Changes in Account Receivables | ||||||||||
| Changes in Inventories | ||||||||||
| Changes in Accounts Payable | ||||||||||
| Capital Expenditure | ||||||||||
| UFCF | 2.6 | 20.9 | -.6 | 9.6 | 4.2 | 6.0 | 9.9 | 12.0 | 14.6 | 17.7 |
| WACC, % | 10.13 | 10.13 | 10.13 | 10.12 | 10.13 | 10.13 | 10.13 | 10.13 | 10.13 | 10.13 |
| PV UFCF | ||||||||||
| SUM PV UFCF | 43.5 | |||||||||
| Long Term Growth Rate, % | 0.50 | |||||||||
| Free cash flow (T + 1) | 18 | |||||||||
| Terminal Value | 185 | |||||||||
| Present Terminal Value | 114 | |||||||||
| Enterprise Value | 158 | |||||||||
| Net Debt | -15 | |||||||||
| Equity Value | 173 | |||||||||
| Diluted Shares Outstanding, MM | 24 | |||||||||
| Equity Value Per Share | 7.15 |
What You Will Receive
- Customizable Excel Template: A fully adaptable Excel-based DCF Calculator featuring pre-filled real PCYO financials.
- Actual Data Insights: Historical data along with forward-looking estimates (highlighted in the yellow cells).
- Assumption Flexibility: Modify forecast parameters such as revenue growth, EBITDA %, and WACC.
- Instant Calculations: Quickly observe how your inputs affect the valuation of Pure Cycle Corporation (PCYO).
- Professional Resource: Designed for investors, CFOs, consultants, and financial analysts.
- Intuitive Layout: Organized for clarity and ease of use, complete with step-by-step guidance.
Key Features
- Comprehensive DCF Calculator: Features detailed unlevered and levered DCF valuation models tailored for Pure Cycle Corporation (PCYO).
- WACC Calculator: Comes with a pre-configured Weighted Average Cost of Capital sheet that allows for customizable inputs.
- Adjustable Forecast Assumptions: Easily modify growth rates, capital expenditures, and discount rates to fit your analysis.
- Integrated Financial Ratios: Evaluate profitability, leverage, and efficiency ratios specific to Pure Cycle Corporation (PCYO).
- Interactive Dashboard and Charts: Visual representations summarize essential valuation metrics for straightforward analysis.
How It Works
- 1. Access the Template: Download and open the Excel file featuring Pure Cycle Corporation’s (PCYO) preloaded data.
- 2. Modify Assumptions: Adjust essential inputs such as growth rates, WACC, and capital expenditures.
- 3. Analyze Results Instantly: The DCF model automatically computes intrinsic value and NPV.
- 4. Experiment with Scenarios: Evaluate various forecasts to explore different valuation results.
- 5. Present with Assurance: Deliver expert valuation insights to bolster your decision-making process.
Why Choose This Calculator for Pure Cycle Corporation (PCYO)?
- Accuracy: Utilizes real Pure Cycle Corporation financials for precise data.
- Flexibility: Allows users to easily test and adjust inputs as needed.
- Time-Saving: Eliminate the need to construct a DCF model from the ground up.
- Professional-Grade: Crafted with the expertise and usability expected at the CFO level.
- User-Friendly: Intuitive design makes it accessible for users without extensive financial modeling skills.
Who Should Use This Product?
- Investors: Evaluate Pure Cycle Corporation’s (PCYO) performance before making investment decisions.
- CFOs and Financial Analysts: Optimize valuation methodologies and assess financial forecasts for (PCYO).
- Startup Founders: Understand the valuation strategies of established companies like Pure Cycle Corporation (PCYO).
- Consultants: Provide detailed valuation insights and reports for clients involving (PCYO).
- Students and Educators: Utilize current data from Pure Cycle Corporation (PCYO) to learn and teach valuation analysis.
What the Template Contains
- Pre-Filled Data: Includes Pure Cycle Corporation’s historical financials and forecasts.
- Discounted Cash Flow Model: Editable DCF valuation model with automatic calculations.
- Weighted Average Cost of Capital (WACC): A dedicated sheet for calculating WACC based on custom inputs.
- Key Financial Ratios: Analyze Pure Cycle Corporation’s profitability, efficiency, and leverage.
- Customizable Inputs: Edit revenue growth, margins, and tax rates with ease.
- Clear Dashboard: Charts and tables summarizing key valuation results.
Disclaimer
All information, articles, and product details provided on this website are for general informational and educational purposes only. We do not claim any ownership over, nor do we intend to infringe upon, any trademarks, copyrights, logos, brand names, or other intellectual property mentioned or depicted on this site. Such intellectual property remains the property of its respective owners, and any references here are made solely for identification or informational purposes, without implying any affiliation, endorsement, or partnership.
We make no representations or warranties, express or implied, regarding the accuracy, completeness, or suitability of any content or products presented. Nothing on this website should be construed as legal, tax, investment, financial, medical, or other professional advice. In addition, no part of this site—including articles or product references—constitutes a solicitation, recommendation, endorsement, advertisement, or offer to buy or sell any securities, franchises, or other financial instruments, particularly in jurisdictions where such activity would be unlawful.
All content is of a general nature and may not address the specific circumstances of any individual or entity. It is not a substitute for professional advice or services. Any actions you take based on the information provided here are strictly at your own risk. You accept full responsibility for any decisions or outcomes arising from your use of this website and agree to release us from any liability in connection with your use of, or reliance upon, the content or products found herein.