
|
Pinduoduo Inc. (PDD) DCF Avaliação |
Totalmente Editável: Adapte-Se Às Suas Necessidades No Excel Ou Planilhas
Design Profissional: Modelos Confiáveis E Padrão Da Indústria
Pré-Construídos Para Uso Rápido E Eficiente
Compatível com MAC/PC, totalmente desbloqueado
Não É Necessária Experiência; Fácil De Seguir
Pinduoduo Inc. (PDD) Bundle
Explore as perspectivas financeiras da Pinduoduo Inc. (PDD) com nossa calculadora DCF! Digite suas projeções de crescimento, margens e despesas para calcular o valor intrínseco da Pinduoduo Inc. (PDD) e aprimorar sua tomada de decisão de investimento.
What You Will Get
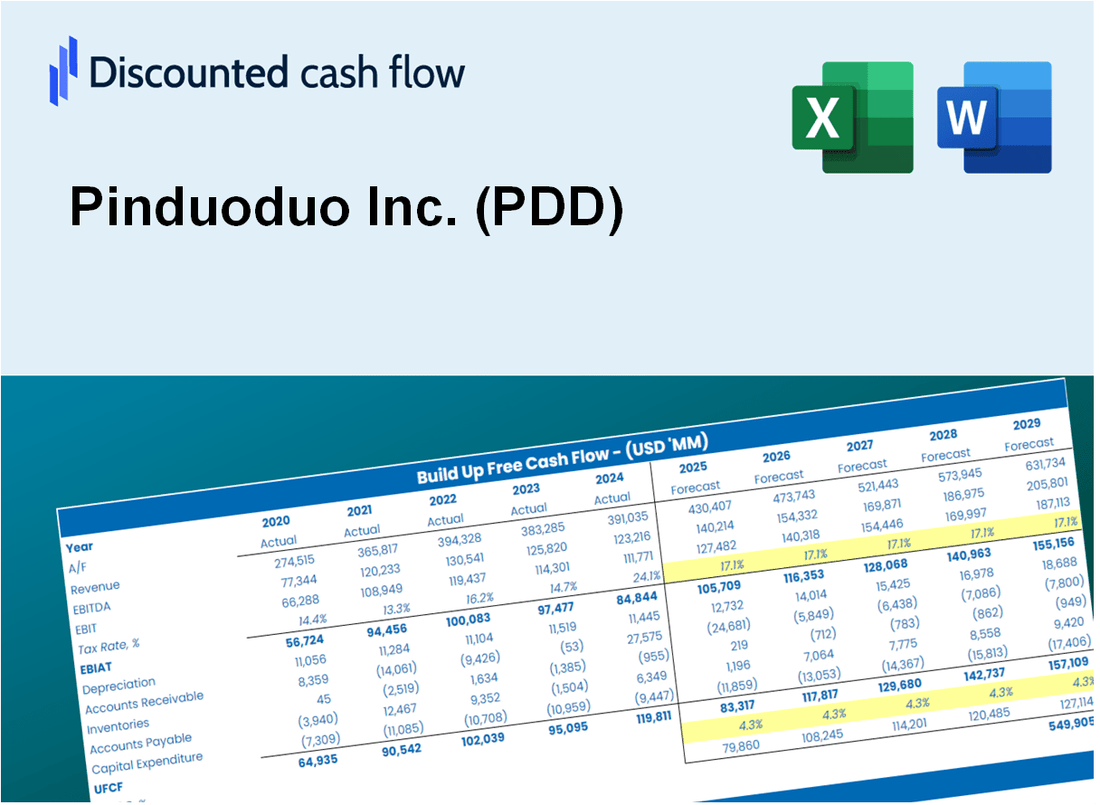
- Editable Excel Template: A fully customizable Excel-based DCF Calculator featuring pre-filled real PDD financials.
- Real-World Data: Historical data and forward-looking estimates (as indicated in the yellow cells).
- Forecast Flexibility: Adjust forecast assumptions such as revenue growth, EBITDA %, and WACC.
- Automatic Calculations: Instantly observe the impact of your inputs on Pinduoduo’s valuation.
- Professional Tool: Designed for investors, CFOs, consultants, and financial analysts.
- User-Friendly Design: Organized for clarity and ease of use, complete with step-by-step instructions.
Key Features
- 🔍 Real-Life PDD Financials: Pre-filled historical and projected data for Pinduoduo Inc. (PDD).
- ✏️ Fully Customizable Inputs: Adjust all critical parameters (yellow cells) like WACC, growth %, and tax rates.
- 📊 Professional DCF Valuation: Built-in formulas calculate Pinduoduo’s intrinsic value using the Discounted Cash Flow method.
- ⚡ Instant Results: Visualize Pinduoduo’s valuation instantly after making changes.
- Scenario Analysis: Test and compare outcomes for various financial assumptions side-by-side.
How It Works
- 1. Download the Template: Obtain and open the Excel file containing Pinduoduo Inc.'s (PDD) financial data.
- 2. Adjust Key Inputs: Modify essential parameters such as growth rates, WACC, and capital expenditures.
- 3. Instant Results: The DCF model automatically computes intrinsic value and NPV in real-time.
- 4. Explore Different Scenarios: Analyze various forecasts to evaluate distinct valuation possibilities.
- 5. Present with Assurance: Deliver expert valuation insights to bolster your decision-making process.
Why Choose Pinduoduo Inc. (PDD)?
- Innovative Shopping Experience: Enjoy a unique social commerce platform that enhances online shopping.
- Cost Savings: Access a wide range of products at competitive prices, maximizing your purchasing power.
- User-Friendly Interface: Navigate the app easily, making your shopping experience seamless and enjoyable.
- Engaging Community: Connect with friends and family to share deals and experiences, fostering a collaborative shopping environment.
- Proven Growth: Benefit from a rapidly expanding platform trusted by millions of users worldwide.
Who Should Use This Product?
- Finance Students: Explore pricing strategies and market dynamics using real-time data from Pinduoduo Inc. (PDD).
- Academics: Integrate industry-specific models into your research or teaching materials.
- Investors: Validate your investment hypotheses and assess valuation metrics for Pinduoduo Inc. (PDD).
- Analysts: Enhance your analysis efficiency with a tailored DCF model for Pinduoduo Inc. (PDD).
- Small Business Owners: Understand the competitive landscape and evaluation methods of major players like Pinduoduo Inc. (PDD).
What the Template Contains
- Pre-Filled Data: Includes Pinduoduo Inc.'s (PDD) historical financials and forecasts.
- Discounted Cash Flow Model: Editable DCF valuation model with automatic calculations.
- Weighted Average Cost of Capital (WACC): A dedicated sheet for calculating WACC based on custom inputs.
- Key Financial Ratios: Analyze Pinduoduo Inc.'s (PDD) profitability, efficiency, and leverage.
- Customizable Inputs: Edit revenue growth, margins, and tax rates with ease.
- Clear Dashboard: Charts and tables summarizing key valuation results.
Disclaimer
All information, articles, and product details provided on this website are for general informational and educational purposes only. We do not claim any ownership over, nor do we intend to infringe upon, any trademarks, copyrights, logos, brand names, or other intellectual property mentioned or depicted on this site. Such intellectual property remains the property of its respective owners, and any references here are made solely for identification or informational purposes, without implying any affiliation, endorsement, or partnership.
We make no representations or warranties, express or implied, regarding the accuracy, completeness, or suitability of any content or products presented. Nothing on this website should be construed as legal, tax, investment, financial, medical, or other professional advice. In addition, no part of this site—including articles or product references—constitutes a solicitation, recommendation, endorsement, advertisement, or offer to buy or sell any securities, franchises, or other financial instruments, particularly in jurisdictions where such activity would be unlawful.
All content is of a general nature and may not address the specific circumstances of any individual or entity. It is not a substitute for professional advice or services. Any actions you take based on the information provided here are strictly at your own risk. You accept full responsibility for any decisions or outcomes arising from your use of this website and agree to release us from any liability in connection with your use of, or reliance upon, the content or products found herein.