
|
Piramal Enterprises Limited (PEL.NS) Avaliação DCF |
Totalmente Editável: Adapte-Se Às Suas Necessidades No Excel Ou Planilhas
Design Profissional: Modelos Confiáveis E Padrão Da Indústria
Pré-Construídos Para Uso Rápido E Eficiente
Compatível com MAC/PC, totalmente desbloqueado
Não É Necessária Experiência; Fácil De Seguir
Piramal Enterprises Limited (PEL.NS) Bundle
Avalie as perspectivas financeiras da Piramal Enterprises Limited (PELNS) como um especialista! Essa calculadora DCF (PELNS) fornece dados financeiros pré-preenchidos e flexibilidade para modificar o crescimento da receita, WACC, margens e outras suposições essenciais para se alinhar às suas previsões.
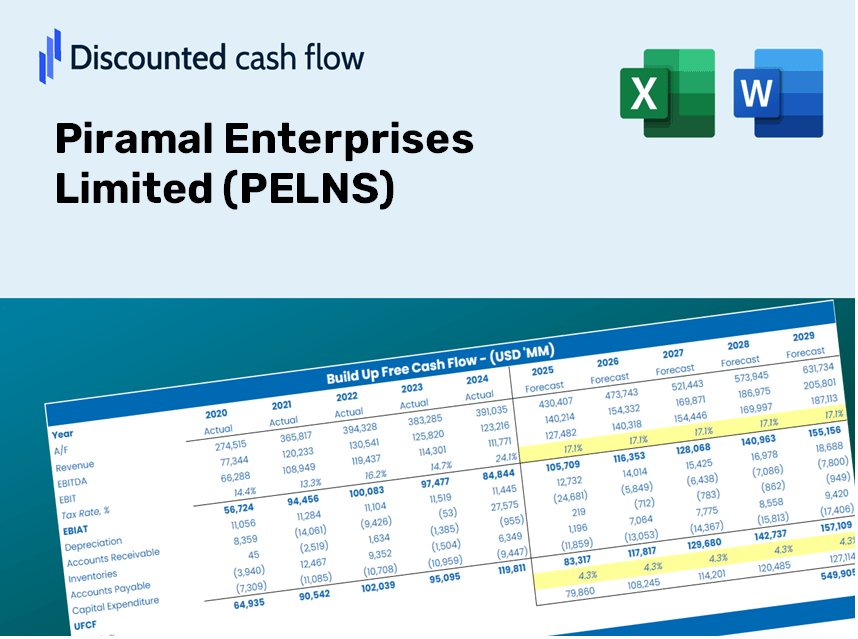
Discounted Cash Flow (DCF) - (USD MM)
| Year | AY1 2021 |
AY2 2022 |
AY3 2023 |
AY4 2024 |
AY5 2025 |
FY1 2026 |
FY2 2027 |
FY3 2028 |
FY4 2029 |
FY5 2030 |
|---|---|---|---|---|---|---|---|---|---|---|
| Revenue | 127,707.6 | 76,427.4 | 80,317.9 | 78,790.6 | 89,161.3 | 83,855.5 | 78,865.4 | 74,172.3 | 69,758.5 | 65,607.3 |
| Revenue Growth, % | 0 | -40.15 | 5.09 | -1.9 | 13.16 | -5.95 | -5.95 | -5.95 | -5.95 | -5.95 |
| EBITDA | 81,051.8 | 56,550.3 | 86,849.5 | 18,944.7 | 61,404.6 | 55,407.1 | 52,109.9 | 49,009.0 | 46,092.6 | 43,349.7 |
| EBITDA, % | 63.47 | 73.99 | 108.13 | 24.04 | 68.87 | 66.07 | 66.07 | 66.07 | 66.07 | 66.07 |
| Depreciation | 5,608.8 | 6,657.8 | 1,228.8 | 8,289.6 | 2,136.9 | 4,620.6 | 4,345.6 | 4,087.0 | 3,843.8 | 3,615.1 |
| Depreciation, % | 4.39 | 8.71 | 1.53 | 10.52 | 2.4 | 5.51 | 5.51 | 5.51 | 5.51 | 5.51 |
| EBIT | 75,443.0 | 49,892.5 | 85,620.7 | 10,655.1 | 59,267.7 | 51,043.1 | 48,005.6 | 45,148.9 | 42,462.2 | 39,935.4 |
| EBIT, % | 59.07 | 65.28 | 106.6 | 13.52 | 66.47 | 60.87 | 60.87 | 60.87 | 60.87 | 60.87 |
| Total Cash | 101,831.7 | 108,602.9 | 46,490.8 | 54,317.9 | 97,614.8 | 68,184.8 | 64,127.3 | 60,311.2 | 56,722.2 | 53,346.8 |
| Total Cash, percent | .0 | .0 | .0 | .0 | .0 | .0 | .0 | .0 | .0 | .0 |
| Account Receivables | 66,408.5 | 106,353.7 | 8,549.4 | 9,867.0 | 11,496.9 | 31,540.1 | 29,663.3 | 27,898.1 | 26,237.9 | 24,676.5 |
| Account Receivables, % | 52 | 139.16 | 10.64 | 12.52 | 12.89 | 37.61 | 37.61 | 37.61 | 37.61 | 37.61 |
| Inventories | 12,992.3 | 15,330.1 | .0 | .0 | .0 | 5,070.2 | 4,768.5 | 4,484.7 | 4,217.9 | 3,966.9 |
| Inventories, % | 10.17 | 20.06 | 0 | 0 | 0 | 6.05 | 6.05 | 6.05 | 6.05 | 6.05 |
| Accounts Payable | 11,786.4 | 16,969.3 | 3,992.7 | 2,945.2 | 4,152.4 | 7,513.2 | 7,066.1 | 6,645.6 | 6,250.2 | 5,878.2 |
| Accounts Payable, % | 9.23 | 22.2 | 4.97 | 3.74 | 4.66 | 8.96 | 8.96 | 8.96 | 8.96 | 8.96 |
| Capital Expenditure | -5,951.8 | -9,584.2 | -2,026.0 | -12,696.9 | -2,737.9 | -6,525.4 | -6,137.1 | -5,771.9 | -5,428.4 | -5,105.4 |
| Capital Expenditure, % | -4.66 | -12.54 | -2.52 | -16.11 | -3.07 | -7.78 | -7.78 | -7.78 | -7.78 | -7.78 |
| Tax Rate, % | 24.72 | 24.72 | 24.72 | 24.72 | 24.72 | 24.72 | 24.72 | 24.72 | 24.72 | 24.72 |
| EBITAT | 29,086.3 | 46,387.2 | 144,659.9 | 5,471.6 | 44,614.6 | 36,562.9 | 34,387.1 | 32,340.8 | 30,416.3 | 28,606.3 |
| Depreciation | ||||||||||
| Changes in Account Receivables | ||||||||||
| Changes in Inventories | ||||||||||
| Changes in Accounts Payable | ||||||||||
| Capital Expenditure | ||||||||||
| UFCF | -38,871.1 | 6,360.7 | 244,020.5 | -1,300.8 | 43,590.9 | 12,905.4 | 34,327.1 | 32,284.4 | 30,363.2 | 28,556.4 |
| WACC, % | 4.11 | 7.27 | 7.67 | 4.85 | 6.24 | 6.03 | 6.03 | 6.03 | 6.03 | 6.03 |
| PV UFCF | ||||||||||
| SUM PV UFCF | 115,127.2 | |||||||||
| Long Term Growth Rate, % | 2.00 | |||||||||
| Free cash flow (T + 1) | 29,127 | |||||||||
| Terminal Value | 723,103 | |||||||||
| Present Terminal Value | 539,628 | |||||||||
| Enterprise Value | 654,755 | |||||||||
| Net Debt | 592,123 | |||||||||
| Equity Value | 62,632 | |||||||||
| Diluted Shares Outstanding, MM | 228 | |||||||||
| Equity Value Per Share | 275.20 |
What You Will Receive
- Pre-Filled Financial Model: Access to Piramal Enterprises Limited's (PELNS) actual data for accurate DCF valuation.
- Comprehensive Forecast Control: Modify revenue growth, profit margins, WACC, and other essential drivers.
- Real-Time Calculations: Automatic updates provide immediate results as you adjust inputs.
- Investor-Ready Template: A polished Excel file crafted for high-quality valuation presentations.
- Customizable and Reusable: Designed for adaptability, enabling repeated use for thorough forecasts.
Key Features
- Sophisticated DCF Calculator: Features comprehensive unlevered and levered DCF valuation models tailored for Piramal Enterprises Limited (PELNS).
- WACC Calculator: Pre-configured Weighted Average Cost of Capital sheet with adjustable inputs specific to PELNS.
- Customizable Forecast Assumptions: Adjust growth rates, capital expenditures, and discount rates for tailored financial projections.
- Integrated Financial Ratios: Evaluate profitability, leverage, and efficiency ratios for Piramal Enterprises Limited (PELNS).
- Interactive Dashboard and Charts: Visual representations that summarize essential valuation metrics for straightforward analysis.
How It Operates
- Download: Obtain the ready-to-use Excel file containing Piramal Enterprises Limited's (PELNS) financial data.
- Customize: Modify forecasts such as revenue growth, EBITDA %, and WACC to suit your analysis.
- Update Automatically: Intrinsic value and NPV calculations refresh in real-time as you make changes.
- Test Scenarios: Generate various projections and instantly compare results side by side.
- Make Decisions: Leverage the valuation findings to inform your investment strategy.
Why Opt for This Calculator?
- Designed for Experts: A sophisticated tool tailored for analysts, CFOs, and consultants.
- Accurate Data: PELNS's historical and projected financials are preloaded for reliable insights.
- Flexible Scenario Analysis: Effortlessly test various forecasts and assumptions.
- Clear Results: Instantly calculates intrinsic value, NPV, and essential metrics.
- User-Friendly: Step-by-step guidance simplifies the entire process.
Who Can Benefit from This Product?
- Investors: Assess Piramal Enterprises Limited’s (PELNS) valuation before making stock trades.
- CFOs and Financial Analysts: Optimize valuation methodologies and validate forecasts.
- Startup Founders: Gain insights into how large public firms like Piramal Enterprises Limited are valued.
- Consultants: Provide comprehensive valuation reports to your clients.
- Students and Educators: Utilize real-world examples to practice and teach valuation strategies.
Contents of the Template
- Preloaded PELNS Data: Historical and projected financial information, including revenue, EBIT, and capital expenditures.
- DCF and WACC Models: Advanced sheets for calculating intrinsic value and Weighted Average Cost of Capital.
- Editable Inputs: Cells highlighted in yellow for adjusting revenue growth, tax rates, and discount rates.
- Financial Statements: Detailed annual and quarterly financials for in-depth analysis.
- Key Ratios: Ratios related to profitability, leverage, and efficiency for performance evaluation.
- Dashboard and Charts: Visual representations of valuation results and underlying assumptions.
Disclaimer
All information, articles, and product details provided on this website are for general informational and educational purposes only. We do not claim any ownership over, nor do we intend to infringe upon, any trademarks, copyrights, logos, brand names, or other intellectual property mentioned or depicted on this site. Such intellectual property remains the property of its respective owners, and any references here are made solely for identification or informational purposes, without implying any affiliation, endorsement, or partnership.
We make no representations or warranties, express or implied, regarding the accuracy, completeness, or suitability of any content or products presented. Nothing on this website should be construed as legal, tax, investment, financial, medical, or other professional advice. In addition, no part of this site—including articles or product references—constitutes a solicitation, recommendation, endorsement, advertisement, or offer to buy or sell any securities, franchises, or other financial instruments, particularly in jurisdictions where such activity would be unlawful.
All content is of a general nature and may not address the specific circumstances of any individual or entity. It is not a substitute for professional advice or services. Any actions you take based on the information provided here are strictly at your own risk. You accept full responsibility for any decisions or outcomes arising from your use of this website and agree to release us from any liability in connection with your use of, or reliance upon, the content or products found herein.