
|
Procter & Gamble Hygiene e Health Care Limited (PGHH.NS) Avaliação DCF |
Totalmente Editável: Adapte-Se Às Suas Necessidades No Excel Ou Planilhas
Design Profissional: Modelos Confiáveis E Padrão Da Indústria
Pré-Construídos Para Uso Rápido E Eficiente
Compatível com MAC/PC, totalmente desbloqueado
Não É Necessária Experiência; Fácil De Seguir
Procter & Gamble Hygiene and Health Care Limited (PGHH.NS) Bundle
Simplificar o Procter & Avaliação de Higiene e Saúde Limitada (PGHHNs) com esta calculadora DCF personalizável! Com verdadeiro Procter & Gamble Hygiene e Health Care Limited Limited (PGHHNS) e insumos de previsão ajustáveis, você pode testar cenários e descobrir Procter & Gamble Hygiene e Health Care Limited (PGHHNS) Valor justo em apenas alguns minutos.
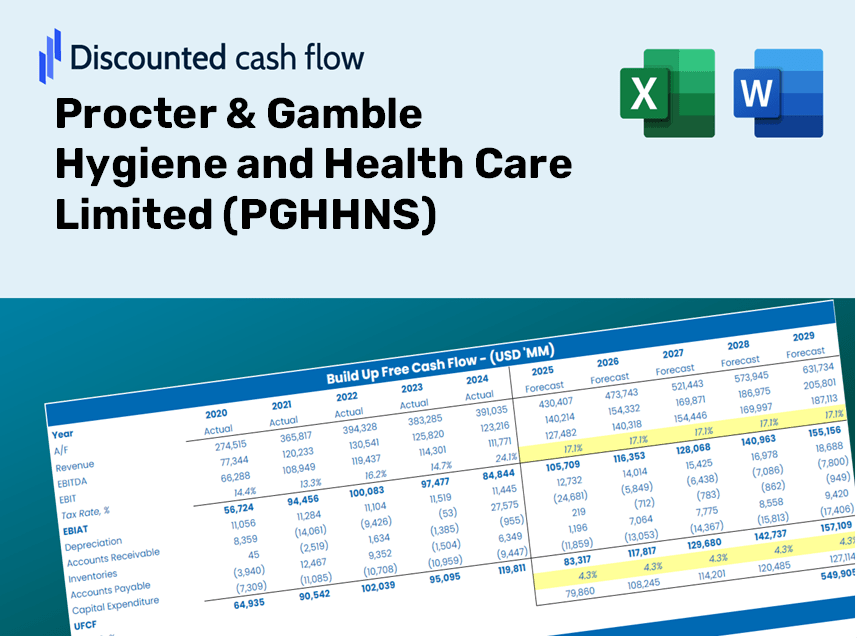
Discounted Cash Flow (DCF) - (USD MM)
| Year | AY1 2021 |
AY2 2022 |
AY3 2023 |
AY4 2024 |
AY5 2025 |
FY1 2026 |
FY2 2027 |
FY3 2028 |
FY4 2029 |
FY5 2030 |
|---|---|---|---|---|---|---|---|---|---|---|
| Revenue | 35,702.4 | 39,009.2 | 39,052.1 | 42,057.0 | 44,992.2 | 47,696.8 | 50,564.1 | 53,603.7 | 56,826.0 | 60,242.1 |
| Revenue Growth, % | 0 | 9.26 | 0.10997 | 7.69 | 6.98 | 6.01 | 6.01 | 6.01 | 6.01 | 6.01 |
| EBITDA | 9,177.3 | 8,430.8 | 8,979.5 | 10,224.8 | 12,112.0 | 11,594.4 | 12,291.4 | 13,030.3 | 13,813.6 | 14,644.0 |
| EBITDA, % | 25.7 | 21.61 | 22.99 | 24.31 | 26.92 | 24.31 | 24.31 | 24.31 | 24.31 | 24.31 |
| Depreciation | 476.6 | 528.8 | 583.6 | 565.0 | 425.9 | 617.7 | 654.8 | 694.2 | 735.9 | 780.1 |
| Depreciation, % | 1.33 | 1.36 | 1.49 | 1.34 | 0.94653 | 1.29 | 1.29 | 1.29 | 1.29 | 1.29 |
| EBIT | 8,700.7 | 7,902.0 | 8,395.9 | 9,659.8 | 11,686.1 | 10,976.8 | 11,636.6 | 12,336.1 | 13,077.7 | 13,863.9 |
| EBIT, % | 24.37 | 20.26 | 21.5 | 22.97 | 25.97 | 23.01 | 23.01 | 23.01 | 23.01 | 23.01 |
| Total Cash | 6,476.7 | 6,249.8 | 9,638.3 | 5,736.7 | 5,158.3 | 8,008.1 | 8,489.5 | 8,999.8 | 9,540.9 | 10,114.4 |
| Total Cash, percent | .0 | .0 | .0 | .0 | .0 | .0 | .0 | .0 | .0 | .0 |
| Account Receivables | 1,732.5 | 2,180.7 | 2,518.2 | 3,339.0 | 3,087.3 | 3,023.2 | 3,205.0 | 3,397.6 | 3,601.9 | 3,818.4 |
| Account Receivables, % | 4.85 | 5.59 | 6.45 | 7.94 | 6.86 | 6.34 | 6.34 | 6.34 | 6.34 | 6.34 |
| Inventories | 2,493.0 | 2,340.2 | 2,198.0 | 2,255.6 | 2,214.0 | 2,756.3 | 2,922.0 | 3,097.7 | 3,283.9 | 3,481.3 |
| Inventories, % | 6.98 | 6 | 5.63 | 5.36 | 4.92 | 5.78 | 5.78 | 5.78 | 5.78 | 5.78 |
| Accounts Payable | 7,541.0 | 7,797.6 | 9,710.7 | 8,516.5 | 8,094.2 | 9,941.7 | 10,539.3 | 11,172.8 | 11,844.5 | 12,556.5 |
| Accounts Payable, % | 21.12 | 19.99 | 24.87 | 20.25 | 17.99 | 20.84 | 20.84 | 20.84 | 20.84 | 20.84 |
| Capital Expenditure | -316.0 | -498.0 | -444.4 | -446.8 | -550.3 | -532.8 | -564.8 | -598.8 | -634.8 | -672.9 |
| Capital Expenditure, % | -0.88509 | -1.28 | -1.14 | -1.06 | -1.22 | -1.12 | -1.12 | -1.12 | -1.12 | -1.12 |
| Tax Rate, % | 26.16 | 26.16 | 26.16 | 26.16 | 26.16 | 26.16 | 26.16 | 26.16 | 26.16 | 26.16 |
| EBITAT | 6,519.2 | 5,757.9 | 6,782.4 | 6,942.7 | 8,628.6 | 8,216.9 | 8,710.8 | 9,234.5 | 9,789.6 | 10,378.1 |
| Depreciation | ||||||||||
| Changes in Account Receivables | ||||||||||
| Changes in Inventories | ||||||||||
| Changes in Accounts Payable | ||||||||||
| Capital Expenditure | ||||||||||
| UFCF | 9,995.3 | 5,749.9 | 8,639.4 | 4,988.3 | 8,375.2 | 9,670.9 | 9,051.0 | 9,595.1 | 10,171.9 | 10,783.4 |
| WACC, % | 4.72 | 4.72 | 4.72 | 4.72 | 4.72 | 4.72 | 4.72 | 4.72 | 4.72 | 4.72 |
| PV UFCF | ||||||||||
| SUM PV UFCF | 42,867.5 | |||||||||
| Long Term Growth Rate, % | 4.00 | |||||||||
| Free cash flow (T + 1) | 11,215 | |||||||||
| Terminal Value | 1,562,629 | |||||||||
| Present Terminal Value | 1,240,954 | |||||||||
| Enterprise Value | 1,283,822 | |||||||||
| Net Debt | -4,784 | |||||||||
| Equity Value | 1,288,606 | |||||||||
| Diluted Shares Outstanding, MM | 32 | |||||||||
| Equity Value Per Share | 39,697.09 |
What You Will Receive
- Authentic PGHHNS Data: Preloaded financial metrics – from revenue to EBIT – based on real and projected statistics.
- Comprehensive Customization: Modify all key parameters (yellow cells) such as WACC, growth %, and tax rates.
- Real-Time Valuation Updates: Automatic recalculations to assess the effects of changes on PGHHNS's fair value.
- Flexible Excel Template: Designed for quick modifications, scenario analysis, and detailed forecasts.
- Efficient and Accurate: Eliminate the need to build models from the ground up while ensuring accuracy and adaptability.
Key Features of Procter & Gamble Hygiene and Health Care Limited (PGHHNS)
- Customizable Financial Inputs: Adjust essential parameters such as sales growth, operating margins, and investment expenditures.
- Instant DCF Valuation: Quickly computes intrinsic value, net present value (NPV), and other key financial metrics.
- Top-Tier Accuracy: Leverages Procter & Gamble's real-world financial data for precise valuation results.
- Streamlined Scenario Analysis: Effortlessly evaluate various assumptions and analyze different outcomes.
- Efficiency Booster: Removes the hassle of constructing intricate valuation models from the ground up.
How It Functions
- Step 1: Download the Excel spreadsheet.
- Step 2: Examine the pre-filled Procter & Gamble Hygiene and Health Care Limited (PGHHNS) data (historical and projected).
- Step 3: Modify key assumptions (yellow cells) according to your analysis.
- Step 4: Observe the automatic updates for Procter & Gamble’s intrinsic value.
- Step 5: Utilize the results for investment decisions or reporting purposes.
Why Opt for This Calculator?
- All-in-One Tool: Offers DCF, WACC, and financial ratio analyses bundled together.
- Personalized Inputs: Modify the yellow-highlighted cells to explore different scenarios.
- In-Depth Analysis: Automatically computes the intrinsic value and Net Present Value for Procter & Gamble Hygiene and Health Care Limited (PGHHNS).
- Preloaded Information: Historical and projected data provide reliable starting points.
- High-Quality Standards: Perfect for financial analysts, investors, and business consultants.
Who Can Benefit from This Product?
- Investors: Evaluate Procter & Gamble Hygiene and Health Care Limited's (PGHHNS) valuation prior to making stock trades.
- CFOs and Financial Analysts: Enhance valuation workflows and assess financial forecasts.
- Startup Founders: Discover how established companies like Procter & Gamble are valued in the market.
- Consultants: Provide comprehensive valuation reports for your clients regarding PGHHNS.
- Students and Educators: Utilize real-world data to practice and teach effective valuation methods.
Contents of the Template
- Pre-Filled Data: Contains historical financials and forecasts for Procter & Gamble Hygiene and Health Care Limited (PGHHNS).
- Discounted Cash Flow Model: An editable DCF valuation model featuring automatic calculations.
- Weighted Average Cost of Capital (WACC): A specialized sheet for WACC calculations based on user-defined inputs.
- Key Financial Ratios: Evaluate Procter & Gamble Hygiene and Health Care Limited’s (PGHHNS) profitability, efficiency, and leverage.
- Customizable Inputs: Easily modify revenue growth, profit margins, and tax rates.
- User-Friendly Dashboard: Visual summaries of key valuation results through charts and tables.
Disclaimer
All information, articles, and product details provided on this website are for general informational and educational purposes only. We do not claim any ownership over, nor do we intend to infringe upon, any trademarks, copyrights, logos, brand names, or other intellectual property mentioned or depicted on this site. Such intellectual property remains the property of its respective owners, and any references here are made solely for identification or informational purposes, without implying any affiliation, endorsement, or partnership.
We make no representations or warranties, express or implied, regarding the accuracy, completeness, or suitability of any content or products presented. Nothing on this website should be construed as legal, tax, investment, financial, medical, or other professional advice. In addition, no part of this site—including articles or product references—constitutes a solicitation, recommendation, endorsement, advertisement, or offer to buy or sell any securities, franchises, or other financial instruments, particularly in jurisdictions where such activity would be unlawful.
All content is of a general nature and may not address the specific circumstances of any individual or entity. It is not a substitute for professional advice or services. Any actions you take based on the information provided here are strictly at your own risk. You accept full responsibility for any decisions or outcomes arising from your use of this website and agree to release us from any liability in connection with your use of, or reliance upon, the content or products found herein.