
|
Phio Pharmaceuticals Corp. (Phio) DCF Avaliação |
Totalmente Editável: Adapte-Se Às Suas Necessidades No Excel Ou Planilhas
Design Profissional: Modelos Confiáveis E Padrão Da Indústria
Pré-Construídos Para Uso Rápido E Eficiente
Compatível com MAC/PC, totalmente desbloqueado
Não É Necessária Experiência; Fácil De Seguir
Phio Pharmaceuticals Corp. (PHIO) Bundle
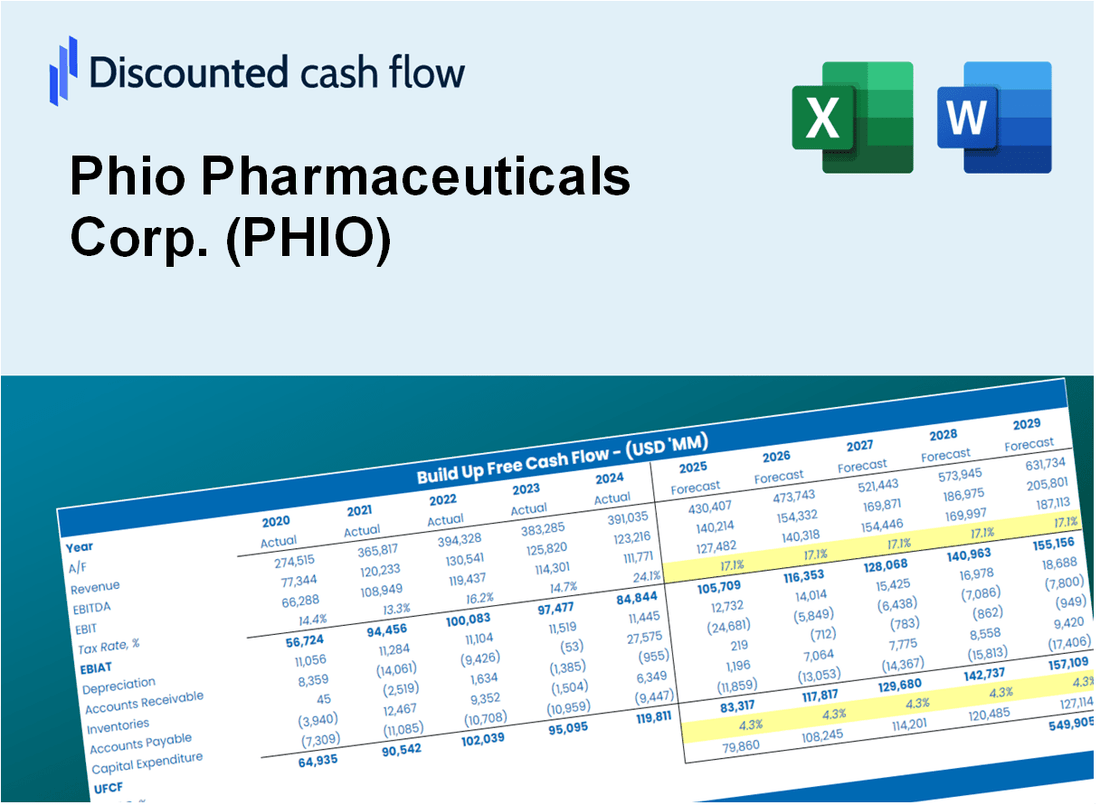
Descubra o verdadeiro potencial da Phio Pharmaceuticals Corp. (PHIO) com nossa calculadora DCF avançada! Ajustar suposições críticas, explorar vários cenários e avaliar os efeitos das mudanças na avaliação do Phio Pharmaceuticals Corp. (Phio) - tudo dentro de um único modelo do Excel.
What You Will Get
- Real PHIO Financials: Access to historical and projected data for precise valuation.
- Customizable Inputs: Adjust WACC, tax rates, revenue growth, and capital expenditures as needed.
- Dynamic Calculations: Intrinsic value and NPV are computed automatically.
- Scenario Analysis: Evaluate various scenarios to assess Phio Pharmaceuticals' future performance.
- User-Friendly Design: Designed for professionals while remaining accessible to newcomers.
Key Features
- 🔍 Real-Life PHIO Financials: Pre-filled historical and projected data for Phio Pharmaceuticals Corp.
- ✏️ Fully Customizable Inputs: Adjust all critical parameters (yellow cells) like WACC, growth %, and tax rates.
- 📊 Professional DCF Valuation: Built-in formulas calculate Phio’s intrinsic value using the Discounted Cash Flow method.
- ⚡ Instant Results: Visualize Phio’s valuation instantly after making changes.
- Scenario Analysis: Test and compare outcomes for various financial assumptions side-by-side.
How It Works
- Download the Template: Gain immediate access to the Excel-based PHIO DCF Calculator.
- Input Your Assumptions: Modify the yellow-highlighted cells for growth rates, WACC, margins, and other variables.
- Instant Calculations: The model automatically computes Phio Pharmaceuticals' intrinsic value.
- Test Scenarios: Experiment with various assumptions to assess potential valuation fluctuations.
- Analyze and Decide: Utilize the outcomes to inform your investment or financial analysis.
Why Choose Phio Pharmaceuticals Corp. (PHIO)?
- Innovative Solutions: Cutting-edge therapies designed to address unmet medical needs.
- Scientific Expertise: Backed by a team of experienced professionals in the pharmaceutical field.
- Robust Pipeline: A diverse range of product candidates in various stages of development.
- Commitment to Quality: Adherence to the highest standards in research and manufacturing processes.
- Proven Track Record: Recognized for delivering results and advancing healthcare solutions.
Who Should Use This Product?
- Investors: Evaluate Phio Pharmaceuticals Corp. (PHIO) to inform stock trading decisions.
- CFOs and Financial Analysts: Optimize valuation methods and validate financial projections.
- Startup Founders: Understand the valuation strategies of established biotech companies like Phio Pharmaceuticals.
- Consultants: Create detailed valuation reports for clients in the pharmaceutical sector.
- Students and Educators: Utilize current data to study and teach valuation practices in the biotech industry.
What the Template Contains
- Preloaded PHIO Data: Historical and projected financial data, including revenue, EBIT, and capital expenditures.
- DCF and WACC Models: Professional-grade sheets for calculating intrinsic value and Weighted Average Cost of Capital.
- Editable Inputs: Yellow-highlighted cells for adjusting revenue growth, tax rates, and discount rates.
- Financial Statements: Comprehensive annual and quarterly financials for deeper analysis.
- Key Ratios: Profitability, leverage, and efficiency ratios to evaluate performance.
- Dashboard and Charts: Visual summaries of valuation outcomes and assumptions.
Disclaimer
All information, articles, and product details provided on this website are for general informational and educational purposes only. We do not claim any ownership over, nor do we intend to infringe upon, any trademarks, copyrights, logos, brand names, or other intellectual property mentioned or depicted on this site. Such intellectual property remains the property of its respective owners, and any references here are made solely for identification or informational purposes, without implying any affiliation, endorsement, or partnership.
We make no representations or warranties, express or implied, regarding the accuracy, completeness, or suitability of any content or products presented. Nothing on this website should be construed as legal, tax, investment, financial, medical, or other professional advice. In addition, no part of this site—including articles or product references—constitutes a solicitation, recommendation, endorsement, advertisement, or offer to buy or sell any securities, franchises, or other financial instruments, particularly in jurisdictions where such activity would be unlawful.
All content is of a general nature and may not address the specific circumstances of any individual or entity. It is not a substitute for professional advice or services. Any actions you take based on the information provided here are strictly at your own risk. You accept full responsibility for any decisions or outcomes arising from your use of this website and agree to release us from any liability in connection with your use of, or reliance upon, the content or products found herein.