
|
Park Aerospace Corp. (PKE) Avaliação DCF |
Totalmente Editável: Adapte-Se Às Suas Necessidades No Excel Ou Planilhas
Design Profissional: Modelos Confiáveis E Padrão Da Indústria
Pré-Construídos Para Uso Rápido E Eficiente
Compatível com MAC/PC, totalmente desbloqueado
Não É Necessária Experiência; Fácil De Seguir
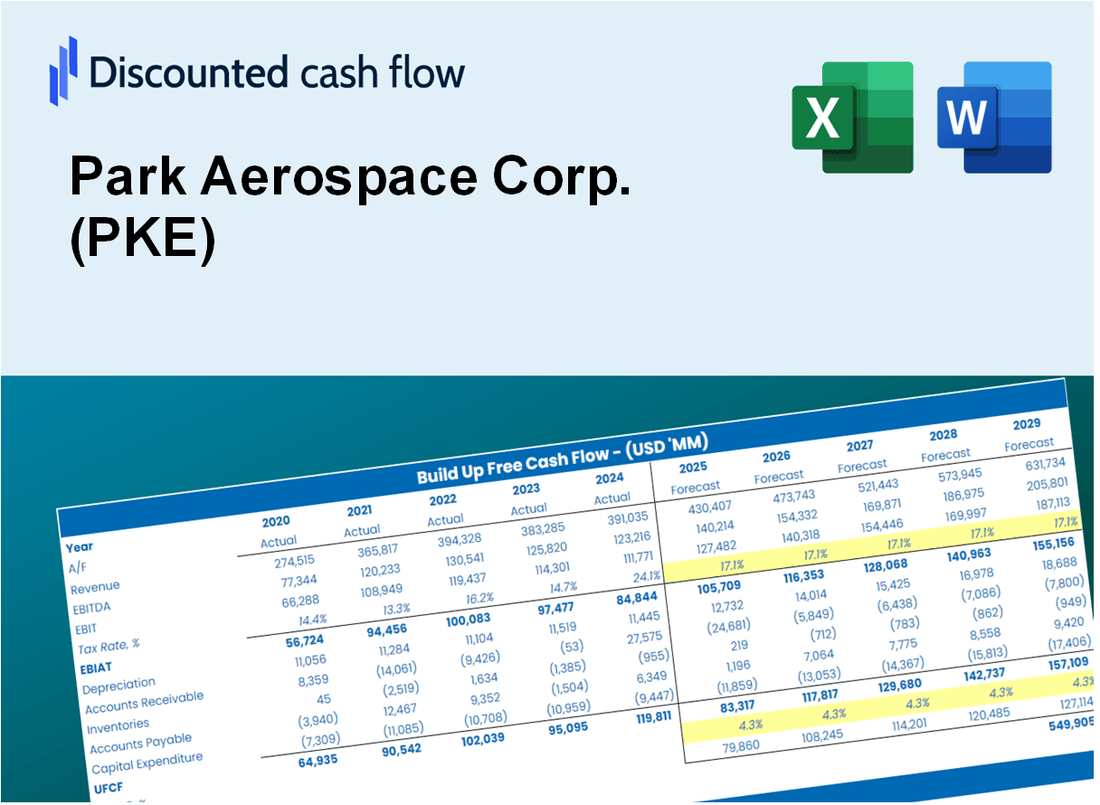
Park Aerospace Corp. (PKE) Bundle
Descubra o verdadeiro valor da Park Aerospace Corp. (PKE) com nossa calculadora DCF avançada! Ajuste as suposições essenciais, explore vários cenários e examine como diferentes fatores influenciam a avaliação do Park Aerospace Corp. (PKE) - tudo dentro de um único modelo do Excel.
Discounted Cash Flow (DCF) - (USD MM)
| Year | AY1 2021 |
AY2 2022 |
AY3 2023 |
AY4 2024 |
AY5 2025 |
FY1 2026 |
FY2 2027 |
FY3 2028 |
FY4 2029 |
FY5 2030 |
|---|---|---|---|---|---|---|---|---|---|---|
| Revenue | 46.3 | 53.6 | 54.1 | 56.0 | 62.0 | 66.8 | 72.0 | 77.6 | 83.6 | 90.1 |
| Revenue Growth, % | 0 | 15.78 | 0.89029 | 3.61 | 10.75 | 7.76 | 7.76 | 7.76 | 7.76 | 7.76 |
| EBITDA | 8.2 | 12.8 | 11.1 | 10.8 | 11.4 | 13.3 | 14.4 | 15.5 | 16.7 | 18.0 |
| EBITDA, % | 17.78 | 23.9 | 20.52 | 19.35 | 18.31 | 19.97 | 19.97 | 19.97 | 19.97 | 19.97 |
| Depreciation | 1.2 | 1.1 | 1.1 | 1.4 | 1.9 | 1.6 | 1.8 | 1.9 | 2.0 | 2.2 |
| Depreciation, % | 2.49 | 2.12 | 2.1 | 2.5 | 2.98 | 2.44 | 2.44 | 2.44 | 2.44 | 2.44 |
| EBIT | 7.1 | 11.7 | 10.0 | 9.4 | 9.5 | 11.7 | 12.6 | 13.6 | 14.7 | 15.8 |
| EBIT, % | 15.3 | 21.78 | 18.41 | 16.84 | 15.33 | 17.53 | 17.53 | 17.53 | 17.53 | 17.53 |
| Total Cash | 116.5 | 110.4 | 105.4 | 77.2 | 68.8 | 66.8 | 72.0 | 77.6 | 83.6 | 90.1 |
| Total Cash, percent | .0 | .0 | .0 | .0 | .0 | .0 | .0 | .0 | .0 | .0 |
| Account Receivables | 7.6 | 8.3 | 10.0 | 12.4 | 12.9 | 12.5 | 13.5 | 14.5 | 15.6 | 16.8 |
| Account Receivables, % | 16.49 | 15.56 | 18.48 | 22.11 | 20.8 | 18.69 | 18.69 | 18.69 | 18.69 | 18.69 |
| Inventories | 4.8 | 4.7 | 6.8 | 6.4 | 7.2 | 7.3 | 7.9 | 8.5 | 9.1 | 9.8 |
| Inventories, % | 10.36 | 8.69 | 12.52 | 11.43 | 11.63 | 10.93 | 10.93 | 10.93 | 10.93 | 10.93 |
| Accounts Payable | 3.3 | 2.5 | 4.5 | 3.5 | 2.5 | 4.1 | 4.4 | 4.7 | 5.1 | 5.5 |
| Accounts Payable, % | 7.13 | 4.73 | 8.41 | 6.27 | 4.05 | 6.12 | 6.12 | 6.12 | 6.12 | 6.12 |
| Capital Expenditure | -7.5 | -4.4 | -1.0 | -.6 | -.9 | -3.9 | -4.2 | -4.5 | -4.8 | -5.2 |
| Capital Expenditure, % | -16.19 | -8.16 | -1.94 | -1.15 | -1.43 | -5.77 | -5.77 | -5.77 | -5.77 | -5.77 |
| Tax Rate, % | 38.13 | 38.13 | 38.13 | 38.13 | 38.13 | 38.13 | 38.13 | 38.13 | 38.13 | 38.13 |
| EBITAT | 4.7 | 8.4 | 9.7 | 7.5 | 5.9 | 8.8 | 9.5 | 10.3 | 11.1 | 11.9 |
| Depreciation | ||||||||||
| Changes in Account Receivables | ||||||||||
| Changes in Inventories | ||||||||||
| Changes in Accounts Payable | ||||||||||
| Capital Expenditure | ||||||||||
| UFCF | -10.7 | 3.8 | 8.0 | 5.2 | 4.5 | 8.5 | 5.9 | 6.4 | 6.8 | 7.4 |
| WACC, % | 5.3 | 5.3 | 5.3 | 5.3 | 5.3 | 5.3 | 5.3 | 5.3 | 5.3 | 5.3 |
| PV UFCF | ||||||||||
| SUM PV UFCF | 30.1 | |||||||||
| Long Term Growth Rate, % | 0.50 | |||||||||
| Free cash flow (T + 1) | 7 | |||||||||
| Terminal Value | 155 | |||||||||
| Present Terminal Value | 119 | |||||||||
| Enterprise Value | 149 | |||||||||
| Net Debt | -21 | |||||||||
| Equity Value | 171 | |||||||||
| Diluted Shares Outstanding, MM | 20 | |||||||||
| Equity Value Per Share | 8.46 |
What You Will Get
- Real PKE Financials: Access to historical and projected data for precise valuation.
- Customizable Inputs: Adjust WACC, tax rates, revenue growth, and capital expenditures as needed.
- Dynamic Calculations: Intrinsic value and NPV are computed in real-time.
- Scenario Analysis: Evaluate various scenarios to assess Park Aerospace's future performance.
- User-Friendly Design: Designed for professionals while remaining approachable for newcomers.
Key Features
- 🔍 Real-Life PKE Financials: Pre-filled historical and projected data for Park Aerospace Corp.
- ✏️ Fully Customizable Inputs: Adjust all critical parameters (yellow cells) like WACC, growth %, and tax rates.
- 📊 Professional DCF Valuation: Built-in formulas calculate Park Aerospace’s intrinsic value using the Discounted Cash Flow method.
- ⚡ Instant Results: Visualize Park Aerospace’s valuation instantly after making changes.
- Scenario Analysis: Test and compare outcomes for various financial assumptions side-by-side.
How It Works
- Download: Obtain the pre-formatted Excel file containing Park Aerospace Corp.'s (PKE) financial data.
- Customize: Modify projections such as revenue growth, EBITDA %, and WACC to fit your analysis.
- Update Automatically: The intrinsic value and NPV calculations refresh in real-time as you make changes.
- Test Scenarios: Develop various forecasts and instantly compare the results.
- Make Decisions: Leverage the valuation outcomes to inform your investment choices.
Why Choose This Calculator for Park Aerospace Corp. (PKE)?
- Accuracy: Utilizes real Park Aerospace financials to ensure precise data.
- Flexibility: Built for users to easily test and adjust inputs as needed.
- Time-Saving: Avoid the complexities of constructing a DCF model from the ground up.
- Professional-Grade: Crafted with the precision and usability expected at the CFO level.
- User-Friendly: Intuitive design makes it accessible for those without extensive financial modeling skills.
Who Should Use This Product?
- Individual Investors: Make informed decisions about buying or selling Park Aerospace Corp. (PKE) stock.
- Financial Analysts: Streamline valuation processes with ready-to-use financial models for Park Aerospace Corp. (PKE).
- Consultants: Deliver professional valuation insights on Park Aerospace Corp. (PKE) to clients quickly and accurately.
- Business Owners: Understand how companies like Park Aerospace Corp. (PKE) are valued to guide your own strategy.
- Finance Students: Learn valuation techniques using real-world data and scenarios related to Park Aerospace Corp. (PKE).
What the Template Contains
- Historical Data: Includes Park Aerospace Corp. (PKE)’s past financials and baseline forecasts.
- DCF and Levered DCF Models: Detailed templates to calculate Park Aerospace Corp. (PKE)’s intrinsic value.
- WACC Sheet: Pre-built calculations for Weighted Average Cost of Capital.
- Editable Inputs: Modify key drivers like growth rates, EBITDA %, and CAPEX assumptions.
- Quarterly and Annual Statements: A complete breakdown of Park Aerospace Corp. (PKE)’s financials.
- Interactive Dashboard: Visualize valuation results and projections dynamically.
Disclaimer
All information, articles, and product details provided on this website are for general informational and educational purposes only. We do not claim any ownership over, nor do we intend to infringe upon, any trademarks, copyrights, logos, brand names, or other intellectual property mentioned or depicted on this site. Such intellectual property remains the property of its respective owners, and any references here are made solely for identification or informational purposes, without implying any affiliation, endorsement, or partnership.
We make no representations or warranties, express or implied, regarding the accuracy, completeness, or suitability of any content or products presented. Nothing on this website should be construed as legal, tax, investment, financial, medical, or other professional advice. In addition, no part of this site—including articles or product references—constitutes a solicitation, recommendation, endorsement, advertisement, or offer to buy or sell any securities, franchises, or other financial instruments, particularly in jurisdictions where such activity would be unlawful.
All content is of a general nature and may not address the specific circumstances of any individual or entity. It is not a substitute for professional advice or services. Any actions you take based on the information provided here are strictly at your own risk. You accept full responsibility for any decisions or outcomes arising from your use of this website and agree to release us from any liability in connection with your use of, or reliance upon, the content or products found herein.