|
Avaliação DCF Posco Holdings Inc. (PKX) |
Totalmente Editável: Adapte-Se Às Suas Necessidades No Excel Ou Planilhas
Design Profissional: Modelos Confiáveis E Padrão Da Indústria
Pré-Construídos Para Uso Rápido E Eficiente
Compatível com MAC/PC, totalmente desbloqueado
Não É Necessária Experiência; Fácil De Seguir
POSCO Holdings Inc. (PKX) Bundle
Explore o futuro financeiro da Posco Holdings Inc. (PKX) com nossa calculadora DCF amigável! Digite suas suposições sobre crescimento, margens e custos para calcular o valor intrínseco da Posco Holdings Inc. (PKX) e aprimorar sua estratégia de investimento.
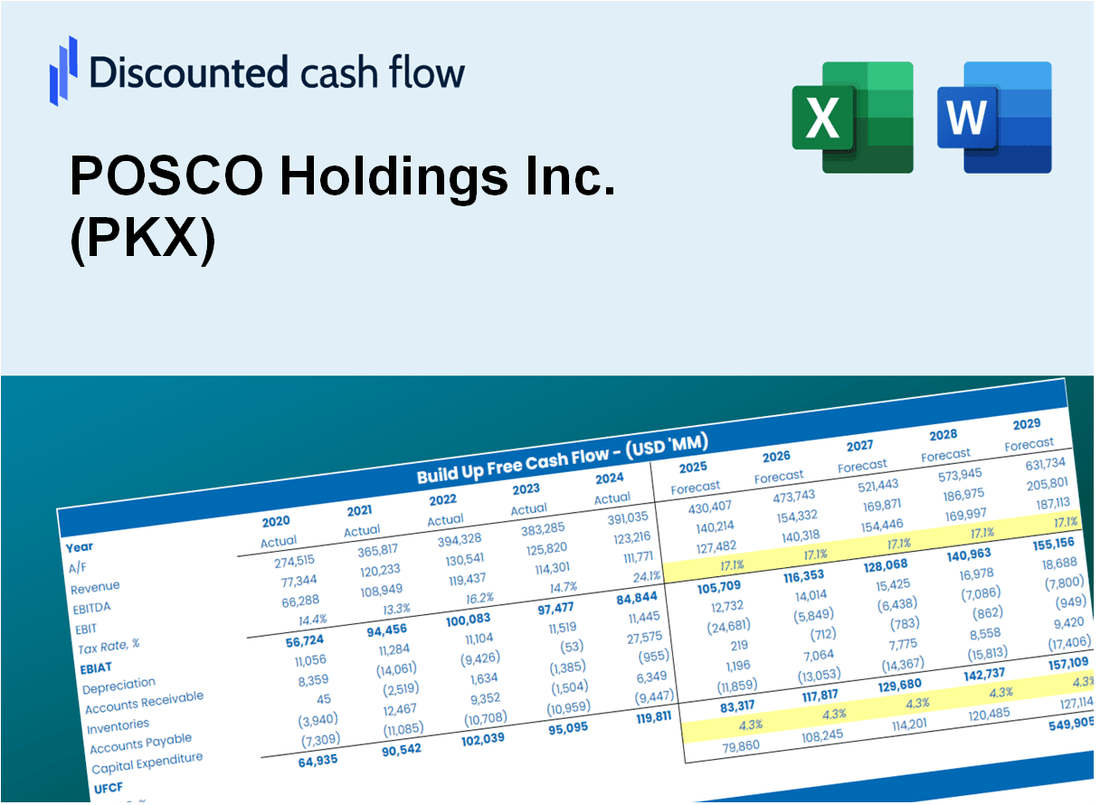
Discounted Cash Flow (DCF) - (USD MM)
| Year | AY1 2020 |
AY2 2021 |
AY3 2022 |
AY4 2023 |
AY5 2024 |
FY1 2025 |
FY2 2026 |
FY3 2027 |
FY4 2028 |
FY5 2029 |
|---|---|---|---|---|---|---|---|---|---|---|
| Revenue | 40,434.6 | 53,405.8 | 59,295.3 | 53,961.9 | 50,856.1 | 54,461.4 | 58,322.4 | 62,457.0 | 66,884.7 | 71,626.4 |
| Revenue Growth, % | 0 | 32.08 | 11.03 | -8.99 | -5.76 | 7.09 | 7.09 | 7.09 | 7.09 | 7.09 |
| EBITDA | 4,178.1 | 8,976.8 | 5,970.7 | 4,962.2 | 4,272.8 | 5,969.9 | 6,393.1 | 6,846.4 | 7,331.7 | 7,851.5 |
| EBITDA, % | 10.33 | 16.81 | 10.07 | 9.2 | 8.4 | 10.96 | 10.96 | 10.96 | 10.96 | 10.96 |
| Depreciation | 2,533.9 | 2,504.4 | 2,584.2 | 2,689.9 | 2,787.7 | 2,808.1 | 3,007.2 | 3,220.4 | 3,448.7 | 3,693.1 |
| Depreciation, % | 6.27 | 4.69 | 4.36 | 4.98 | 5.48 | 5.16 | 5.16 | 5.16 | 5.16 | 5.16 |
| EBIT | 1,644.1 | 6,472.5 | 3,386.5 | 2,272.3 | 1,485.1 | 3,161.8 | 3,385.9 | 3,626.0 | 3,883.0 | 4,158.3 |
| EBIT, % | 4.07 | 12.12 | 5.71 | 4.21 | 2.92 | 5.81 | 5.81 | 5.81 | 5.81 | 5.81 |
| Total Cash | 11,449.4 | 12,703.0 | 13,110.9 | 12,528.7 | 10,356.3 | 12,830.5 | 13,740.1 | 14,714.2 | 15,757.3 | 16,874.4 |
| Total Cash, percent | .0 | .0 | .0 | .0 | .0 | .0 | .0 | .0 | .0 | .0 |
| Account Receivables | 6,765.5 | 8,524.1 | 8,474.5 | 7,723.6 | 7,584.1 | 8,301.1 | 8,889.6 | 9,519.8 | 10,194.7 | 10,917.4 |
| Account Receivables, % | 16.73 | 15.96 | 14.29 | 14.31 | 14.91 | 15.24 | 15.24 | 15.24 | 15.24 | 15.24 |
| Inventories | 6,333.1 | 10,645.2 | 10,825.2 | 10,185.1 | 9,895.5 | 10,041.0 | 10,752.8 | 11,515.1 | 12,331.4 | 13,205.6 |
| Inventories, % | 15.66 | 19.93 | 18.26 | 18.87 | 19.46 | 18.44 | 18.44 | 18.44 | 18.44 | 18.44 |
| Accounts Payable | 3,187.6 | 4,549.8 | 4,858.5 | 4,867.4 | 4,309.2 | 4,584.5 | 4,909.5 | 5,257.6 | 5,630.3 | 6,029.5 |
| Accounts Payable, % | 7.88 | 8.52 | 8.19 | 9.02 | 8.47 | 8.42 | 8.42 | 8.42 | 8.42 | 8.42 |
| Capital Expenditure | -2,447.1 | -2,456.3 | -3,792.4 | -5,056.4 | -5,368.8 | -4,027.4 | -4,312.9 | -4,618.6 | -4,946.0 | -5,296.7 |
| Capital Expenditure, % | -6.05 | -4.6 | -6.4 | -9.37 | -10.56 | -7.39 | -7.39 | -7.39 | -7.39 | -7.39 |
| Tax Rate, % | 12.49 | 12.49 | 12.49 | 12.49 | 12.49 | 12.49 | 12.49 | 12.49 | 12.49 | 12.49 |
| EBITAT | 1,300.7 | 4,548.6 | 2,652.3 | 1,464.2 | 1,299.6 | 2,400.8 | 2,571.0 | 2,753.3 | 2,948.5 | 3,157.5 |
| Depreciation | ||||||||||
| Changes in Account Receivables | ||||||||||
| Changes in Inventories | ||||||||||
| Changes in Accounts Payable | ||||||||||
| Capital Expenditure | ||||||||||
| UFCF | -8,523.4 | -111.9 | 1,622.4 | 497.8 | -1,410.5 | 594.4 | 290.0 | 310.6 | 332.6 | 356.2 |
| WACC, % | 9.23 | 9.15 | 9.22 | 9.11 | 9.3 | 9.2 | 9.2 | 9.2 | 9.2 | 9.2 |
| PV UFCF | ||||||||||
| SUM PV UFCF | 1,489.3 | |||||||||
| Long Term Growth Rate, % | 2.00 | |||||||||
| Free cash flow (T + 1) | 363 | |||||||||
| Terminal Value | 5,045 | |||||||||
| Present Terminal Value | 3,249 | |||||||||
| Enterprise Value | 4,738 | |||||||||
| Net Debt | 14,088 | |||||||||
| Equity Value | -9,349 | |||||||||
| Diluted Shares Outstanding, MM | 1,430 | |||||||||
| Equity Value Per Share | -6.54 |
What You Will Receive
- Adjustable Forecast Parameters: Easily modify assumptions (growth %, margins, WACC) to generate various scenarios.
- Comprehensive Data: POSCO Holdings Inc.'s financial data pre-loaded to facilitate your analysis.
- Automated DCF Calculations: The template computes Net Present Value (NPV) and intrinsic value automatically.
- Tailored and Professional Design: A sleek Excel model that conforms to your valuation requirements.
- Designed for Analysts and Investors: Perfect for evaluating projections, confirming strategies, and enhancing efficiency.
Key Features
- 🔍 Real-Life POSCO Financials: Pre-filled historical and projected data for POSCO Holdings Inc. (PKX).
- ✏️ Fully Customizable Inputs: Adjust all critical parameters (yellow cells) like WACC, growth %, and tax rates.
- 📊 Professional DCF Valuation: Built-in formulas calculate POSCO’s intrinsic value using the Discounted Cash Flow method.
- ⚡ Instant Results: Visualize POSCO’s valuation instantly after making changes.
- Scenario Analysis: Test and compare outcomes for various financial assumptions side-by-side.
How It Works
- Download: Obtain the pre-prepared Excel file containing POSCO Holdings Inc.'s (PKX) financial data.
- Customize: Modify projections, including revenue growth, EBITDA %, and WACC.
- Update Automatically: The intrinsic value and NPV calculations refresh in real-time.
- Test Scenarios: Develop various projections and instantly compare their results.
- Make Decisions: Leverage the valuation outcomes to inform your investment strategy.
Why Choose This Calculator for POSCO Holdings Inc. (PKX)?
- User-Friendly Interface: Tailored for both novices and seasoned professionals.
- Customizable Inputs: Adjust variables easily to suit your financial analysis.
- Real-Time Feedback: Observe immediate updates to POSCO’s valuation as you change inputs.
- Pre-Loaded Data: Comes with POSCO’s actual financial figures for swift evaluations.
- Preferred by Experts: Utilized by investors and analysts for strategic decision-making.
Who Should Use This Product?
- Finance Students: Explore advanced valuation methods and apply them to real-world data.
- Academics: Integrate industry-standard models into your teaching or research projects.
- Investors: Validate your investment hypotheses and evaluate the valuation metrics for POSCO Holdings Inc. (PKX).
- Analysts: Enhance your analysis process with a customizable DCF model tailored for your needs.
- Small Business Owners: Understand the analytical approaches used for assessing large corporations like POSCO Holdings Inc. (PKX).
What the Template Contains
- Comprehensive DCF Model: Editable template featuring detailed valuation calculations tailored for POSCO Holdings Inc. (PKX).
- Real-World Data: POSCO Holdings Inc.’s historical and projected financials preloaded for in-depth analysis.
- Customizable Parameters: Modify WACC, growth rates, and tax assumptions to explore various scenarios.
- Financial Statements: Complete annual and quarterly breakdowns for enhanced insights into performance.
- Key Ratios: Integrated analysis for assessing profitability, efficiency, and leverage metrics.
- Dashboard with Visual Outputs: Engaging charts and tables providing clear, actionable results.
Disclaimer
All information, articles, and product details provided on this website are for general informational and educational purposes only. We do not claim any ownership over, nor do we intend to infringe upon, any trademarks, copyrights, logos, brand names, or other intellectual property mentioned or depicted on this site. Such intellectual property remains the property of its respective owners, and any references here are made solely for identification or informational purposes, without implying any affiliation, endorsement, or partnership.
We make no representations or warranties, express or implied, regarding the accuracy, completeness, or suitability of any content or products presented. Nothing on this website should be construed as legal, tax, investment, financial, medical, or other professional advice. In addition, no part of this site—including articles or product references—constitutes a solicitation, recommendation, endorsement, advertisement, or offer to buy or sell any securities, franchises, or other financial instruments, particularly in jurisdictions where such activity would be unlawful.
All content is of a general nature and may not address the specific circumstances of any individual or entity. It is not a substitute for professional advice or services. Any actions you take based on the information provided here are strictly at your own risk. You accept full responsibility for any decisions or outcomes arising from your use of this website and agree to release us from any liability in connection with your use of, or reliance upon, the content or products found herein.