
|
Plus500 Ltd. (Plus.L) Avaliação DCF |
Totalmente Editável: Adapte-Se Às Suas Necessidades No Excel Ou Planilhas
Design Profissional: Modelos Confiáveis E Padrão Da Indústria
Pré-Construídos Para Uso Rápido E Eficiente
Compatível com MAC/PC, totalmente desbloqueado
Não É Necessária Experiência; Fácil De Seguir
Plus500 Ltd. (PLUS.L) Bundle
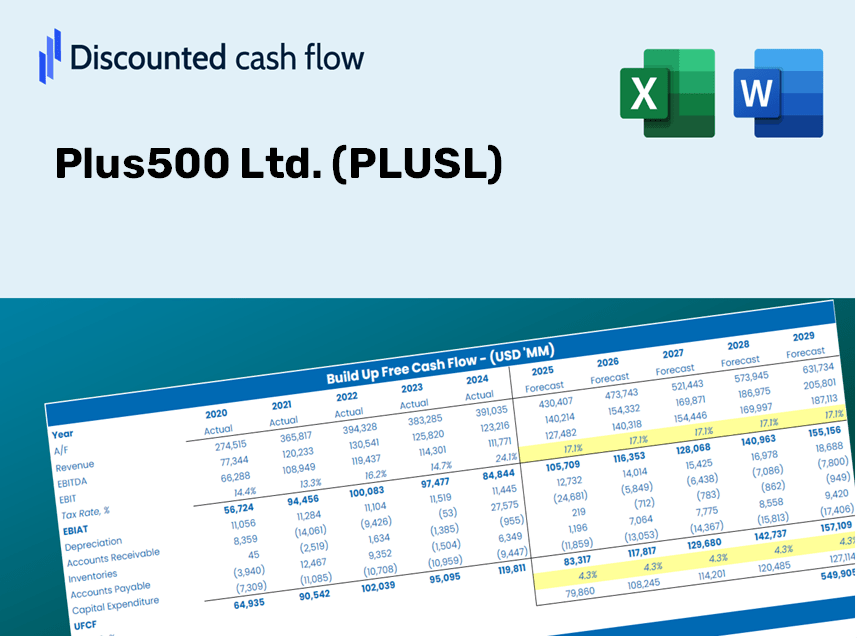
Procurando avaliar o valor intrínseco da Plus500 Ltd.? Nossa calculadora Plusl DCF integra dados do mundo real com extensos recursos de personalização, permitindo refinar suas previsões e aprimorar suas opções de investimento.
Discounted Cash Flow (DCF) - (USD MM)
| Year | AY1 2020 |
AY2 2021 |
AY3 2022 |
AY4 2023 |
AY5 2024 |
FY1 2025 |
FY2 2026 |
FY3 2027 |
FY4 2028 |
FY5 2029 |
|---|---|---|---|---|---|---|---|---|---|---|
| Revenue | 657.9 | 539.7 | 619.6 | 546.6 | 540.9 | 519.2 | 498.5 | 478.5 | 459.4 | 441.0 |
| Revenue Growth, % | 0 | -17.96 | 14.8 | -11.79 | -1.04 | -4 | -4 | -4 | -4 | -4 |
| EBITDA | 404.7 | 302.1 | 376.3 | 264.0 | 265.3 | 286.2 | 274.7 | 263.8 | 253.2 | 243.1 |
| EBITDA, % | 61.52 | 55.98 | 60.73 | 48.31 | 49.04 | 55.12 | 55.12 | 55.12 | 55.12 | 55.12 |
| Depreciation | 1.7 | 1.9 | 2.6 | 3.1 | 4.7 | 2.6 | 2.5 | 2.4 | 2.3 | 2.2 |
| Depreciation, % | 0.26571 | 0.35206 | 0.41708 | 0.57016 | 0.87128 | 0.49526 | 0.49526 | 0.49526 | 0.49526 | 0.49526 |
| EBIT | 403.0 | 300.2 | 373.7 | 260.9 | 260.5 | 283.6 | 272.3 | 261.4 | 250.9 | 240.9 |
| EBIT, % | 61.25 | 55.63 | 60.32 | 47.74 | 48.17 | 54.62 | 54.62 | 54.62 | 54.62 | 54.62 |
| Total Cash | 451.4 | 569.7 | 707.0 | 691.3 | 677.6 | 486.6 | 467.2 | 448.5 | 430.6 | 413.3 |
| Total Cash, percent | .0 | .0 | .0 | .0 | .0 | .0 | .0 | .0 | .0 | .0 |
| Account Receivables | .0 | .0 | .0 | 14.7 | 3.8 | 3.5 | 3.4 | 3.2 | 3.1 | 3.0 |
| Account Receivables, % | 0 | 0 | 0 | 2.68 | 0.70264 | 0.67731 | 0.67731 | 0.67731 | 0.67731 | 0.67731 |
| Inventories | .0 | .0 | .0 | .0 | .0 | .0 | .0 | .0 | .0 | .0 |
| Inventories, % | 0 | 0 | 0 | 0 | 0 | 0 | 0 | 0 | 0 | 0 |
| Accounts Payable | 17.9 | 12.2 | 16.8 | 32.5 | 32.5 | 20.4 | 19.6 | 18.8 | 18.1 | 17.3 |
| Accounts Payable, % | 2.71 | 2.27 | 2.71 | 5.95 | 6 | 3.93 | 3.93 | 3.93 | 3.93 | 3.93 |
| Capital Expenditure | -.2 | -.6 | -.6 | -6.2 | -3.6 | -2.1 | -2.1 | -2.0 | -1.9 | -1.8 |
| Capital Expenditure, % | -0.03465804 | -0.11266 | -0.09813543 | -1.14 | -0.67454 | -0.41206 | -0.41206 | -0.41206 | -0.41206 | -0.41206 |
| Tax Rate, % | 19.01 | 19.01 | 19.01 | 19.01 | 19.01 | 19.01 | 19.01 | 19.01 | 19.01 | 19.01 |
| EBITAT | 385.1 | 241.3 | 291.9 | 210.6 | 211.0 | 235.8 | 226.4 | 217.3 | 208.7 | 200.3 |
| Depreciation | ||||||||||
| Changes in Account Receivables | ||||||||||
| Changes in Inventories | ||||||||||
| Changes in Accounts Payable | ||||||||||
| Capital Expenditure | ||||||||||
| UFCF | 404.5 | 237.0 | 298.4 | 208.6 | 222.9 | 224.5 | 226.1 | 217.1 | 208.4 | 200.1 |
| WACC, % | 5.43 | 5.4 | 5.39 | 5.4 | 5.4 | 5.4 | 5.4 | 5.4 | 5.4 | 5.4 |
| PV UFCF | ||||||||||
| SUM PV UFCF | 924.6 | |||||||||
| Long Term Growth Rate, % | 2.00 | |||||||||
| Free cash flow (T + 1) | 204 | |||||||||
| Terminal Value | 5,997 | |||||||||
| Present Terminal Value | 4,609 | |||||||||
| Enterprise Value | 5,534 | |||||||||
| Net Debt | -664 | |||||||||
| Equity Value | 6,198 | |||||||||
| Diluted Shares Outstanding, MM | 79 | |||||||||
| Equity Value Per Share | 7,826.80 |
What You Will Receive
- Adjustable Forecast Metrics: Effortlessly modify assumptions (growth %, margins, WACC) to explore various scenarios.
- Accurate Market Data: Plus500 Ltd.'s (PLUSL) financial data pre-populated to kickstart your evaluation.
- Automated DCF Calculations: The tool computes Net Present Value (NPV) and intrinsic value automatically.
- Tailorable and Professional: A refined Excel model that suits your valuation requirements.
- Designed for Analysts and Investors: Perfect for analyzing projections, validating strategies, and enhancing productivity.
Key Features
- Real-Life PLUSL Data: Pre-populated with Plus500 Ltd.'s historical financial performance and future projections.
- Fully Customizable Inputs: Tailor revenue growth, profit margins, WACC, tax rates, and capital expenditures to your preferences.
- Dynamic Valuation Model: Instant updates to Net Present Value (NPV) and intrinsic value reflecting your customized inputs.
- Scenario Testing: Generate various forecasting scenarios to evaluate different valuation results.
- User-Friendly Design: Intuitive, organized, and suitable for both seasoned professionals and newcomers.
How It Operates
- Step 1: Download the Plus500 Ltd. (PLUSL) Excel file.
- Step 2: Evaluate the pre-filled data for Plus500 Ltd. (PLUSL) (historical and projected).
- Step 3: Modify key assumptions (highlighted in yellow) according to your analysis.
- Step 4: Observe automatic recalculations for the intrinsic value of Plus500 Ltd. (PLUSL).
- Step 5: Utilize the results for investment decisions or reporting purposes.
Why Choose Plus500's Calculator?
- Accuracy: Reliable data sourced from Plus500 Ltd. ensures precise calculations.
- Flexibility: Users can effortlessly test and adjust inputs to meet their needs.
- Time-Saving: Eliminate the complexities of creating a model from the ground up.
- Professional-Grade: Crafted with the precision and functionality expected by financial experts.
- User-Friendly: Intuitive design accommodates users of all experience levels, from beginners to seasoned professionals.
Who Should Utilize Plus500 Ltd. (PLUSL)?
- Investors: Assess Plus500 Ltd.'s fair value accurately to inform your investment choices.
- CFOs: Utilize a top-tier DCF model for comprehensive financial reporting and analysis.
- Consultants: Efficiently modify the template for client valuation reports centered on Plus500 Ltd. (PLUSL).
- Entrepreneurs: Discover financial modeling techniques employed by leading companies in the sector.
- Educators: Employ this resource as a teaching aid to illustrate various valuation methodologies.
Contents of the Template
- Historical Data: A comprehensive overview of Plus500 Ltd.'s (PLUSL) previous financial performance and foundational forecasts.
- DCF and Levered DCF Models: In-depth templates designed to determine Plus500 Ltd.'s (PLUSL) intrinsic value.
- WACC Sheet: Predefined calculations for the Weighted Average Cost of Capital tailored to Plus500 Ltd. (PLUSL).
- Editable Inputs: Customize vital parameters such as growth rates, EBITDA percentages, and CAPEX assumptions.
- Quarterly and Annual Statements: An extensive analysis of Plus500 Ltd.'s (PLUSL) financial statements.
- Interactive Dashboard: A dynamic interface to visualize valuation outcomes and forecasts for Plus500 Ltd. (PLUSL).
Disclaimer
All information, articles, and product details provided on this website are for general informational and educational purposes only. We do not claim any ownership over, nor do we intend to infringe upon, any trademarks, copyrights, logos, brand names, or other intellectual property mentioned or depicted on this site. Such intellectual property remains the property of its respective owners, and any references here are made solely for identification or informational purposes, without implying any affiliation, endorsement, or partnership.
We make no representations or warranties, express or implied, regarding the accuracy, completeness, or suitability of any content or products presented. Nothing on this website should be construed as legal, tax, investment, financial, medical, or other professional advice. In addition, no part of this site—including articles or product references—constitutes a solicitation, recommendation, endorsement, advertisement, or offer to buy or sell any securities, franchises, or other financial instruments, particularly in jurisdictions where such activity would be unlawful.
All content is of a general nature and may not address the specific circumstances of any individual or entity. It is not a substitute for professional advice or services. Any actions you take based on the information provided here are strictly at your own risk. You accept full responsibility for any decisions or outcomes arising from your use of this website and agree to release us from any liability in connection with your use of, or reliance upon, the content or products found herein.