
|
PB Fintech Limited (PolicyBzr.NS) DCF Avaliação |
Totalmente Editável: Adapte-Se Às Suas Necessidades No Excel Ou Planilhas
Design Profissional: Modelos Confiáveis E Padrão Da Indústria
Pré-Construídos Para Uso Rápido E Eficiente
Compatível com MAC/PC, totalmente desbloqueado
Não É Necessária Experiência; Fácil De Seguir
PB Fintech Limited (POLICYBZR.NS) Bundle
Descubra o verdadeiro potencial da PB Fintech Limited com nossa calculadora DCF avançada! Ajuste as principais suposições, explore vários cenários e examine como as mudanças influenciam a avaliação da PB Fintech Limited - tudo dentro de um modelo abrangente do Excel.
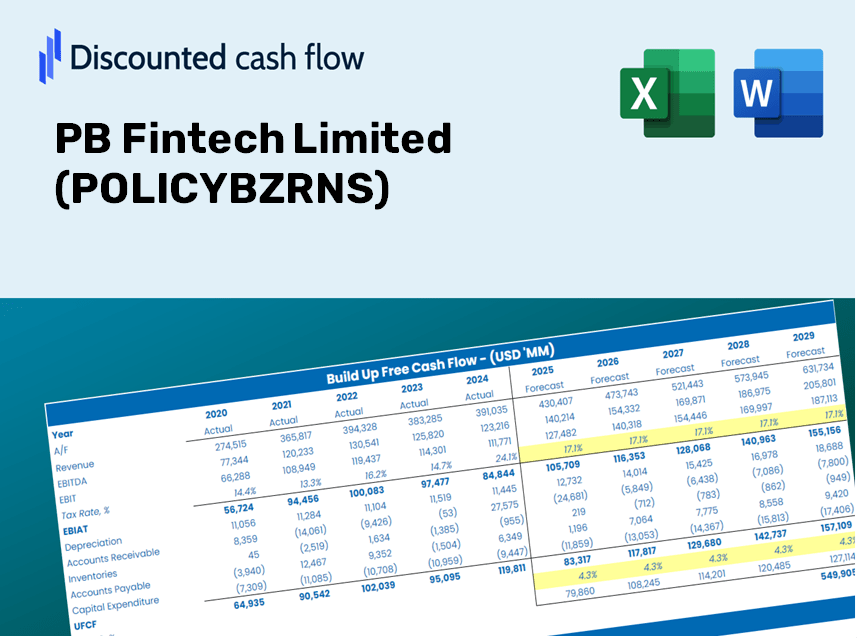
Discounted Cash Flow (DCF) - (USD MM)
| Year | AY1 2021 |
AY2 2022 |
AY3 2023 |
AY4 2024 |
AY5 2025 |
FY1 2026 |
FY2 2027 |
FY3 2028 |
FY4 2029 |
FY5 2030 |
|---|---|---|---|---|---|---|---|---|---|---|
| Revenue | 8,866.6 | 14,248.9 | 25,578.5 | 34,376.8 | 49,772.1 | 77,071.6 | 119,344.6 | 184,803.9 | 286,167.0 | 443,126.8 |
| Revenue Growth, % | 0 | 60.7 | 79.51 | 34.4 | 44.78 | 54.85 | 54.85 | 54.85 | 54.85 | 54.85 |
| EBITDA | -888.8 | -7,767.5 | -4,023.7 | 1,945.7 | 936.8 | -11,210.1 | -17,358.8 | -26,879.9 | -41,623.2 | -64,453.1 |
| EBITDA, % | -10.02 | -54.51 | -15.73 | 5.66 | 1.88 | -14.55 | -14.55 | -14.55 | -14.55 | -14.55 |
| Depreciation | 413.8 | 428.4 | 638.2 | 887.2 | 1,212.7 | 2,340.8 | 3,624.7 | 5,612.8 | 8,691.3 | 13,458.4 |
| Depreciation, % | 4.67 | 3.01 | 2.5 | 2.58 | 2.44 | 3.04 | 3.04 | 3.04 | 3.04 | 3.04 |
| EBIT | -1,302.5 | -8,195.9 | -4,661.9 | 1,058.5 | -275.9 | -13,550.9 | -20,983.4 | -32,492.6 | -50,314.5 | -77,911.5 |
| EBIT, % | -14.69 | -57.52 | -18.23 | 3.08 | -0.55433 | -17.58 | -17.58 | -17.58 | -17.58 | -17.58 |
| Total Cash | 19,465.3 | 51,561.0 | 34,001.5 | 40,992.4 | 27,659.9 | 70,223.5 | 108,740.4 | 168,383.4 | 260,740.0 | 403,753.3 |
| Total Cash, percent | .0 | .0 | .0 | .0 | .0 | .0 | .0 | .0 | .0 | .0 |
| Account Receivables | 1,789.1 | 3,613.5 | 6,924.0 | 6,505.2 | 10,233.0 | 17,277.9 | 26,754.6 | 41,429.2 | 64,152.7 | 99,339.8 |
| Account Receivables, % | 20.18 | 25.36 | 27.07 | 18.92 | 20.56 | 22.42 | 22.42 | 22.42 | 22.42 | 22.42 |
| Inventories | .0 | .0 | .0 | .0 | .0 | .0 | .0 | .0 | .0 | .0 |
| Inventories, % | 0 | 0 | 0 | 0 | 0 | 0 | 0 | 0 | 0 | 0 |
| Accounts Payable | 1,019.1 | 1,981.9 | 3,061.0 | 3,010.6 | 3,669.4 | 8,246.7 | 12,770.0 | 19,774.2 | 30,620.1 | 47,414.9 |
| Accounts Payable, % | 11.49 | 13.91 | 11.97 | 8.76 | 7.37 | 10.7 | 10.7 | 10.7 | 10.7 | 10.7 |
| Capital Expenditure | -58.2 | -327.4 | -657.0 | -633.5 | -971.2 | -1,436.2 | -2,223.9 | -3,443.7 | -5,332.5 | -8,257.4 |
| Capital Expenditure, % | -0.65662 | -2.3 | -2.57 | -1.84 | -1.95 | -1.86 | -1.86 | -1.86 | -1.86 | -1.86 |
| Tax Rate, % | 8.93 | 8.93 | 8.93 | 8.93 | 8.93 | 8.93 | 8.93 | 8.93 | 8.93 | 8.93 |
| EBITAT | -1,379.0 | -8,191.2 | -4,661.8 | 919.4 | -251.3 | -12,951.2 | -20,054.8 | -31,054.7 | -48,087.8 | -74,463.5 |
| Depreciation | ||||||||||
| Changes in Account Receivables | ||||||||||
| Changes in Inventories | ||||||||||
| Changes in Accounts Payable | ||||||||||
| Capital Expenditure | ||||||||||
| UFCF | -1,793.3 | -8,951.8 | -6,912.0 | 1,541.6 | -3,078.8 | -14,514.1 | -23,607.5 | -36,556.0 | -56,606.6 | -87,654.8 |
| WACC, % | 5.74 | 5.74 | 5.74 | 5.73 | 5.73 | 5.73 | 5.73 | 5.73 | 5.73 | 5.73 |
| PV UFCF | ||||||||||
| SUM PV UFCF | -177,388.5 | |||||||||
| Long Term Growth Rate, % | 2.00 | |||||||||
| Free cash flow (T + 1) | -89,408 | |||||||||
| Terminal Value | -2,394,449 | |||||||||
| Present Terminal Value | -1,811,895 | |||||||||
| Enterprise Value | -1,989,284 | |||||||||
| Net Debt | -4,709 | |||||||||
| Equity Value | -1,984,575 | |||||||||
| Diluted Shares Outstanding, MM | 461 | |||||||||
| Equity Value Per Share | -4,300.73 |
What You Will Receive
- Pre-Filled Financial Model: Utilize PB Fintech Limited's actual data for accurate DCF valuations.
- Comprehensive Forecast Control: Modify revenue growth rates, profit margins, WACC, and other essential variables.
- Real-Time Calculations: Automatic updates guarantee that you get immediate results as you make adjustments.
- Professional-Grade Template: A polished Excel file crafted for high-quality valuation presentations.
- Flexible and Reusable: Designed for adaptability, enabling ongoing use for in-depth forecasting.
Key Features
- Robust DCF Calculator: Features comprehensive unlevered and levered DCF valuation frameworks.
- WACC Calculator: Offers a ready-to-use Weighted Average Cost of Capital template with adjustable parameters.
- Customizable Forecast Assumptions: Adjust growth projections, capital expenditures, and discount rates as needed.
- Integrated Financial Ratios: Evaluate profitability, leverage, and efficiency ratios specifically for PB Fintech Limited (POLICYBZRNS).
- Interactive Dashboard and Charts: Visual representations that succinctly present essential valuation metrics for straightforward analysis.
How It Works
- 1. Access the Template: Download and open the Excel file containing PB Fintech Limited’s (POLICYBZRNS) preloaded data.
- 2. Modify Assumptions: Adjust key inputs such as growth rates, WACC, and capital expenditures to fit your analysis.
- 3. Observe Results in Real-Time: The DCF model calculates intrinsic value and NPV dynamically as you make changes.
- 4. Explore Various Scenarios: Analyze different valuation outcomes by comparing multiple forecasts.
- 5. Present with Confidence: Utilize professional valuation insights to reinforce your investment decisions.
Why Choose This Calculator for PB Fintech Limited (POLICYBZRNS)?
- Accurate Data: Utilize up-to-date PB Fintech financials for trustworthy valuation outcomes.
- Customizable: Tailor essential parameters such as growth rates, WACC, and tax rates to align with your forecasts.
- Time-Saving: Built-in calculations streamline the process, so you don't have to begin from square one.
- Professional-Grade Tool: Crafted for use by investors, analysts, and consultants in the industry.
- User-Friendly: Easy-to-navigate design and clear instructions make it accessible for everyone.
Who Can Benefit from PB Fintech Limited (POLICYBZRNS)?
- Investors: Empower your investment choices with a top-tier valuation tool tailored for accuracy.
- Financial Analysts: Streamline your workflow with a customizable DCF model that's ready for immediate use.
- Consultants: Effortlessly modify the template for impactful client presentations or detailed reports.
- Finance Enthusiasts: Enhance your knowledge of valuation methods through real-life case studies.
- Educators and Students: Utilize this resource as a hands-on learning aid in finance courses.
What the Template Includes
- Pre-Filled DCF Model: PB Fintech Limited’s financial data preloaded for immediate usage.
- WACC Calculator: Comprehensive calculations for Weighted Average Cost of Capital.
- Financial Ratios: Assess PB Fintech Limited’s profitability, leverage, and efficiency metrics.
- Editable Inputs: Modify assumptions such as growth rates, margins, and CAPEX to suit your scenarios.
- Financial Statements: Annual and quarterly reports available for thorough analysis.
- Interactive Dashboard: Effortlessly visualize key valuation metrics and outcomes.
Disclaimer
All information, articles, and product details provided on this website are for general informational and educational purposes only. We do not claim any ownership over, nor do we intend to infringe upon, any trademarks, copyrights, logos, brand names, or other intellectual property mentioned or depicted on this site. Such intellectual property remains the property of its respective owners, and any references here are made solely for identification or informational purposes, without implying any affiliation, endorsement, or partnership.
We make no representations or warranties, express or implied, regarding the accuracy, completeness, or suitability of any content or products presented. Nothing on this website should be construed as legal, tax, investment, financial, medical, or other professional advice. In addition, no part of this site—including articles or product references—constitutes a solicitation, recommendation, endorsement, advertisement, or offer to buy or sell any securities, franchises, or other financial instruments, particularly in jurisdictions where such activity would be unlawful.
All content is of a general nature and may not address the specific circumstances of any individual or entity. It is not a substitute for professional advice or services. Any actions you take based on the information provided here are strictly at your own risk. You accept full responsibility for any decisions or outcomes arising from your use of this website and agree to release us from any liability in connection with your use of, or reliance upon, the content or products found herein.