
|
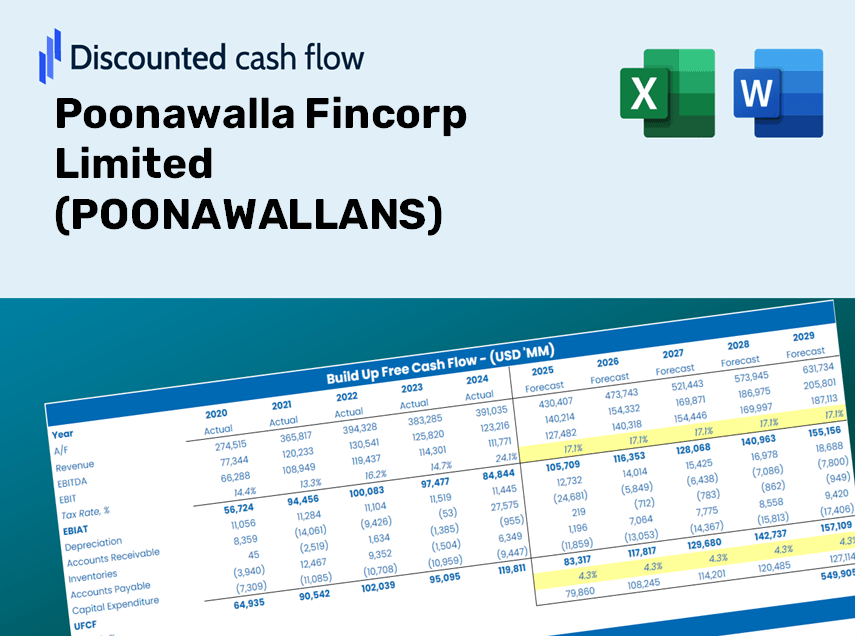
POONAWALLA FINCORP LIMITED (POONAWALLA.NS) Avaliação DCF |
Totalmente Editável: Adapte-Se Às Suas Necessidades No Excel Ou Planilhas
Design Profissional: Modelos Confiáveis E Padrão Da Indústria
Pré-Construídos Para Uso Rápido E Eficiente
Compatível com MAC/PC, totalmente desbloqueado
Não É Necessária Experiência; Fácil De Seguir
Poonawalla Fincorp Limited (POONAWALLA.NS) Bundle
Explore as perspectivas financeiras da Poonawalla FinCorp Limited (Poonawallans) com nossa calculadora DCF amigável! Digite suas projeções de crescimento, margens e despesas para calcular o valor intrínseco da Poonawalla FinCorp Limited (Poonawallans) e refine sua abordagem de investimento.
Discounted Cash Flow (DCF) - (USD MM)
| Year | AY1 2021 |
AY2 2022 |
AY3 2023 |
AY4 2024 |
AY5 2025 |
FY1 2026 |
FY2 2027 |
FY3 2028 |
FY4 2029 |
FY5 2030 |
|---|---|---|---|---|---|---|---|---|---|---|
| Revenue | 23,518.6 | 15,682.4 | 19,958.7 | 30,868.3 | 40,667.6 | 48,837.2 | 58,648.1 | 70,429.8 | 84,578.3 | 101,569.0 |
| Revenue Growth, % | 0 | -33.32 | 27.27 | 54.66 | 31.75 | 20.09 | 20.09 | 20.09 | 20.09 | 20.09 |
| EBITDA | 4,199.0 | 9,141.7 | 13,143.2 | 8,358.2 | 13,878.7 | 19,847.7 | 23,834.9 | 28,623.0 | 34,373.0 | 41,278.2 |
| EBITDA, % | 17.85 | 58.29 | 65.85 | 27.08 | 34.13 | 40.64 | 40.64 | 40.64 | 40.64 | 40.64 |
| Depreciation | 562.5 | 494.9 | 614.1 | 593.1 | 651.0 | 1,186.4 | 1,424.8 | 1,711.0 | 2,054.7 | 2,467.4 |
| Depreciation, % | 2.39 | 3.16 | 3.08 | 1.92 | 1.6 | 2.43 | 2.43 | 2.43 | 2.43 | 2.43 |
| EBIT | 3,636.4 | 8,646.8 | 12,529.1 | 7,765.1 | 13,227.7 | 18,661.3 | 22,410.1 | 26,912.0 | 32,318.4 | 38,810.7 |
| EBIT, % | 15.46 | 55.14 | 62.78 | 25.16 | 32.53 | 38.21 | 38.21 | 38.21 | 38.21 | 38.21 |
| Total Cash | 8,772.9 | 7,304.3 | 6,574.3 | 2,685.4 | 14,416.5 | 15,722.4 | 18,880.8 | 22,673.7 | 27,228.6 | 32,698.5 |
| Total Cash, percent | .0 | .0 | .0 | .0 | .0 | .0 | .0 | .0 | .0 | .0 |
| Account Receivables | 1,958.2 | 1,408.7 | 2,979.8 | 2,116.5 | 327,136.7 | 13,586.0 | 16,315.3 | 19,592.9 | 23,528.8 | 28,255.5 |
| Account Receivables, % | 8.33 | 8.98 | 14.93 | 6.86 | 804.42 | 27.82 | 27.82 | 27.82 | 27.82 | 27.82 |
| Inventories | 37,616.0 | 52,676.2 | 210,299.1 | .0 | .0 | 29,302.3 | 35,188.8 | 42,257.9 | 50,747.0 | 60,941.4 |
| Inventories, % | 159.94 | 335.89 | 1053.67 | 0 | 0 | 60 | 60 | 60 | 60 | 60 |
| Accounts Payable | 940.9 | 151.3 | 20.2 | 12.4 | 39.3 | 508.2 | 610.3 | 733.0 | 880.2 | 1,057.0 |
| Accounts Payable, % | 4 | 0.96478 | 0.10121 | 0.04017066 | 0.09663713 | 1.04 | 1.04 | 1.04 | 1.04 | 1.04 |
| Capital Expenditure | -225.3 | -628.0 | -810.2 | -94.1 | -433.2 | -1,015.0 | -1,219.0 | -1,463.8 | -1,757.9 | -2,111.0 |
| Capital Expenditure, % | -0.95813 | -4 | -4.06 | -0.30484 | -1.07 | -2.08 | -2.08 | -2.08 | -2.08 | -2.08 |
| Tax Rate, % | 27.37 | 27.37 | 27.37 | 27.37 | 27.37 | 27.37 | 27.37 | 27.37 | 27.37 | 27.37 |
| EBITAT | 2,714.6 | 8,306.0 | 11,411.0 | 6,122.6 | 9,607.2 | 15,424.1 | 18,522.6 | 22,243.5 | 26,712.0 | 32,078.1 |
| Depreciation | ||||||||||
| Changes in Account Receivables | ||||||||||
| Changes in Inventories | ||||||||||
| Changes in Accounts Payable | ||||||||||
| Capital Expenditure | ||||||||||
| UFCF | -35,581.4 | -7,127.4 | -148,110.2 | 217,776.2 | -315,168.3 | 300,312.7 | 10,214.7 | 12,266.7 | 14,730.9 | 17,690.2 |
| WACC, % | 4.4 | 4.71 | 4.63 | 4.46 | 4.37 | 4.51 | 4.51 | 4.51 | 4.51 | 4.51 |
| PV UFCF | ||||||||||
| SUM PV UFCF | 333,976.8 | |||||||||
| Long Term Growth Rate, % | 2.00 | |||||||||
| Free cash flow (T + 1) | 18,044 | |||||||||
| Terminal Value | 718,143 | |||||||||
| Present Terminal Value | 575,927 | |||||||||
| Enterprise Value | 909,904 | |||||||||
| Net Debt | 260,566 | |||||||||
| Equity Value | 649,338 | |||||||||
| Diluted Shares Outstanding, MM | 774 | |||||||||
| Equity Value Per Share | 838.58 |
What You Will Receive
- Customizable Excel Template: A comprehensive Excel-based DCF Calculator featuring pre-populated financial data for Poonawalla Fincorp Limited (POONAWALLANS).
- Accurate Financial Data: Access to historical performance metrics and future projections (highlighted in the yellow cells).
- Adjustable Forecasts: Modify key assumptions such as revenue growth, EBITDA percentage, and WACC.
- Real-Time Calculations: Immediately observe how your inputs affect Poonawalla Fincorp's valuation.
- Professional Resource: Designed for investors, CFOs, consultants, and financial analysts.
- Intuitive Interface: Organized for clarity and ease of navigation, complete with step-by-step guidance.
Key Features
- Comprehensive Financial Data: Access Poonawalla Fincorp Limited’s (POONAWALLANS) historical financial statements and pre-filled projections.
- Customizable Assumptions: Modify WACC, tax rates, revenue growth, and EBITDA margins to fit your analysis.
- Real-Time Insights: Witness the recalculation of Poonawalla Fincorp Limited’s (POONAWALLANS) intrinsic value instantly.
- Intuitive Visual Representations: Dashboard charts showcase valuation outcomes and essential metrics clearly.
- Designed for Precision: A robust tool tailored for analysts, investors, and finance professionals.
How It Works
- 1. Access the Template: Download and open the Excel file containing Poonawalla Fincorp Limited (POONAWALLANS)'s preloaded data.
- 2. Adjust Assumptions: Modify key inputs such as growth rates, WACC, and capital expenditures as needed.
- 3. View Immediate Results: The DCF model automatically calculates intrinsic value and NPV in real-time.
- 4. Explore Scenarios: Analyze various forecasts to evaluate different valuation results.
- 5. Make Informed Decisions: Present detailed valuation insights that bolster your strategic decisions.
Why Opt for This Calculator?
- Designed for Experts: A sophisticated tool favored by analysts, CFOs, and consultants.
- Accurate Data: Poonawalla Fincorp's historical and projected financials are preloaded for precision.
- Versatile Scenario Analysis: Effortlessly test various forecasts and assumptions.
- Comprehensive Outputs: Instantly calculates intrinsic value, NPV, and essential metrics.
- User-Friendly: Step-by-step guidance simplifies the process for all users.
Who Can Benefit from Our Product?
- Investors: Evaluate the valuation of Poonawalla Fincorp Limited (POONAWALLANS) prior to making investment decisions.
- CFOs and Financial Analysts: Enhance efficiency in valuation methodologies and validate financial forecasts.
- Startup Founders: Gain insights into how well-established firms like Poonawalla Fincorp Limited (POONAWALLANS) determine their market value.
- Consultants: Provide comprehensive valuation analyses and reports for your clients.
- Students and Educators: Utilize up-to-date data for practicing and teaching valuation concepts.
Contents of the Template
- Historical Data: Includes Poonawalla Fincorp Limited’s past financial performance and baseline forecasts.
- DCF and Levered DCF Models: Comprehensive templates to assess the intrinsic value of Poonawalla Fincorp Limited (POONAWALLANS).
- WACC Sheet: Pre-configured calculations for the Weighted Average Cost of Capital.
- Editable Inputs: Customize essential drivers such as growth rates, EBITDA percentages, and CAPEX assumptions.
- Quarterly and Annual Statements: A thorough analysis of Poonawalla Fincorp Limited’s financials.
- Interactive Dashboard: Dynamically visualize valuation outcomes and future projections.
Disclaimer
All information, articles, and product details provided on this website are for general informational and educational purposes only. We do not claim any ownership over, nor do we intend to infringe upon, any trademarks, copyrights, logos, brand names, or other intellectual property mentioned or depicted on this site. Such intellectual property remains the property of its respective owners, and any references here are made solely for identification or informational purposes, without implying any affiliation, endorsement, or partnership.
We make no representations or warranties, express or implied, regarding the accuracy, completeness, or suitability of any content or products presented. Nothing on this website should be construed as legal, tax, investment, financial, medical, or other professional advice. In addition, no part of this site—including articles or product references—constitutes a solicitation, recommendation, endorsement, advertisement, or offer to buy or sell any securities, franchises, or other financial instruments, particularly in jurisdictions where such activity would be unlawful.
All content is of a general nature and may not address the specific circumstances of any individual or entity. It is not a substitute for professional advice or services. Any actions you take based on the information provided here are strictly at your own risk. You accept full responsibility for any decisions or outcomes arising from your use of this website and agree to release us from any liability in connection with your use of, or reliance upon, the content or products found herein.