
|
Profase Labs, Inc. (PRPH) Avaliação DCF |
Totalmente Editável: Adapte-Se Às Suas Necessidades No Excel Ou Planilhas
Design Profissional: Modelos Confiáveis E Padrão Da Indústria
Pré-Construídos Para Uso Rápido E Eficiente
Compatível com MAC/PC, totalmente desbloqueado
Não É Necessária Experiência; Fácil De Seguir
ProPhase Labs, Inc. (PRPH) Bundle
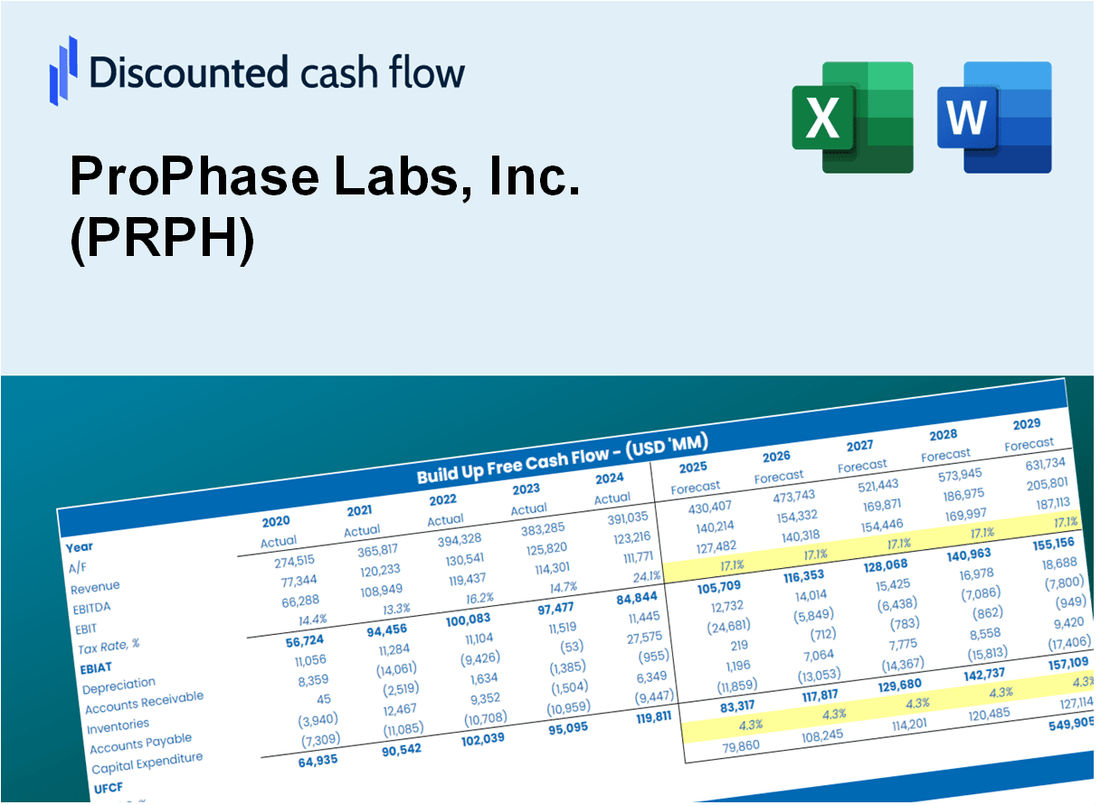
Ganhe domínio sobre o seu Prophase Labs, Inc. (PRPH) Análise de avaliação usando nossa calculadora DCF de última geração! Este modelo do Excel é pré -carregado com dados PRPH reais, permitindo que você ajuste as previsões e suposições para calcular com precisão o valor intrínseco do Prophase Labs, Inc. (PRPH).
What You Will Get
- Editable Excel Template: A fully customizable Excel-based DCF Calculator featuring pre-filled real PRPH financials.
- Real-World Data: Historical data and forward-looking estimates (as indicated in the yellow cells).
- Forecast Flexibility: Adjust forecast assumptions such as revenue growth, EBITDA %, and WACC.
- Automatic Calculations: Quickly observe the effect of your inputs on ProPhase Labs' valuation.
- Professional Tool: Designed for investors, CFOs, consultants, and financial analysts.
- User-Friendly Design: Organized for clarity and ease of use, complete with step-by-step instructions.
Key Features
- Current PRPH Data: Pre-filled with ProPhase Labs’ historical performance metrics and future growth estimates.
- Fully Customizable Inputs: Modify revenue growth rates, profit margins, discount rates, tax assumptions, and capital expenditures.
- Dynamic Valuation Model: Instant updates to Net Present Value (NPV) and intrinsic value reflecting your adjustments.
- Scenario Testing: Develop various forecasting scenarios to evaluate different valuation possibilities.
- User-Friendly Design: Intuitive, organized, and suitable for both seasoned professionals and newcomers.
How It Works
- 1. Access the Template: Download and open the Excel file containing ProPhase Labs, Inc. (PRPH) data.
- 2. Modify Assumptions: Adjust critical inputs such as growth rates, WACC, and capital expenditures.
- 3. See Results Immediately: The DCF model automatically computes intrinsic value and NPV.
- 4. Explore Scenarios: Evaluate various forecasts to assess different valuation results.
- 5. Present with Assurance: Deliver expert valuation insights to back your strategic decisions.
Why Choose ProPhase Labs, Inc. (PRPH) Calculator?
- Accuracy: Utilizes real ProPhase Labs financial data for reliable results.
- Flexibility: Allows users to easily adjust and experiment with various inputs.
- Time-Saving: Eliminate the need to create a financial model from the ground up.
- Professional-Grade: Crafted with precision and usability tailored for finance professionals.
- User-Friendly: Intuitive design makes it accessible for users of all skill levels.
Who Should Use ProPhase Labs, Inc. (PRPH)?
- Healthcare Professionals: Understand the latest trends in health supplements and their market potential.
- Researchers: Utilize ProPhase Labs' data for studies related to health and wellness products.
- Investors: Evaluate investment opportunities and analyze the financial performance of ProPhase Labs, Inc. (PRPH).
- Market Analysts: Enhance your reports with insights from ProPhase Labs' innovative product lines.
- Entrepreneurs: Learn from ProPhase Labs' business strategies to inform your own health-focused ventures.
What the Template Contains
- Pre-Filled Data: Includes ProPhase Labs, Inc.'s (PRPH) historical financials and forecasts.
- Discounted Cash Flow Model: Editable DCF valuation model with automatic calculations.
- Weighted Average Cost of Capital (WACC): A dedicated sheet for calculating WACC based on custom inputs.
- Key Financial Ratios: Analyze ProPhase Labs, Inc.'s (PRPH) profitability, efficiency, and leverage.
- Customizable Inputs: Edit revenue growth, margins, and tax rates with ease.
- Clear Dashboard: Charts and tables summarizing key valuation results.
Disclaimer
All information, articles, and product details provided on this website are for general informational and educational purposes only. We do not claim any ownership over, nor do we intend to infringe upon, any trademarks, copyrights, logos, brand names, or other intellectual property mentioned or depicted on this site. Such intellectual property remains the property of its respective owners, and any references here are made solely for identification or informational purposes, without implying any affiliation, endorsement, or partnership.
We make no representations or warranties, express or implied, regarding the accuracy, completeness, or suitability of any content or products presented. Nothing on this website should be construed as legal, tax, investment, financial, medical, or other professional advice. In addition, no part of this site—including articles or product references—constitutes a solicitation, recommendation, endorsement, advertisement, or offer to buy or sell any securities, franchises, or other financial instruments, particularly in jurisdictions where such activity would be unlawful.
All content is of a general nature and may not address the specific circumstances of any individual or entity. It is not a substitute for professional advice or services. Any actions you take based on the information provided here are strictly at your own risk. You accept full responsibility for any decisions or outcomes arising from your use of this website and agree to release us from any liability in connection with your use of, or reliance upon, the content or products found herein.