
|
A avaliação PRS REIT PLC (PRSR.L) DCF |
Totalmente Editável: Adapte-Se Às Suas Necessidades No Excel Ou Planilhas
Design Profissional: Modelos Confiáveis E Padrão Da Indústria
Pré-Construídos Para Uso Rápido E Eficiente
Compatível com MAC/PC, totalmente desbloqueado
Não É Necessária Experiência; Fácil De Seguir
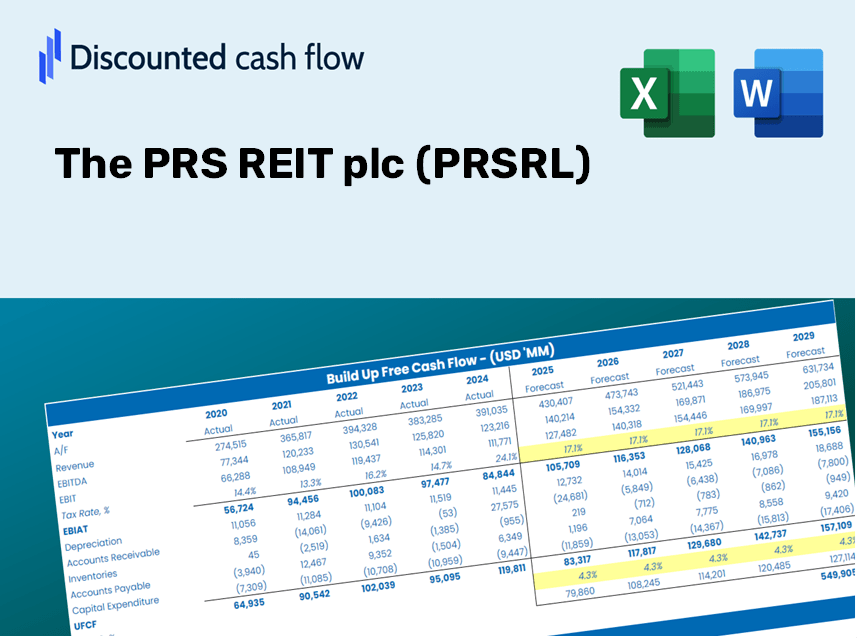
The PRS REIT plc (PRSR.L) Bundle
Aprimore suas estratégias de investimento com a calculadora DCF (PRSRL)! Explore dados financeiros reais para o PRS REIT PLC, ajuste as projeções e despesas de crescimento e observe instantaneamente como essas modificações afetam o valor intrínseco de (PRSRL).
Discounted Cash Flow (DCF) - (USD MM)
| Year | AY1 2019 |
AY2 2020 |
AY3 2021 |
AY4 2022 |
AY5 2023 |
FY1 2024 |
FY2 2025 |
FY3 2026 |
FY4 2027 |
FY5 2028 |
|---|---|---|---|---|---|---|---|---|---|---|
| Revenue | 12.9 | 26.6 | 42.4 | 51.3 | 99.4 | 167.5 | 282.2 | 475.5 | 801.2 | 1,349.9 |
| Revenue Growth, % | 0 | 105.76 | 59.31 | 21.01 | 93.63 | 68.49 | 68.49 | 68.49 | 68.49 | 68.49 |
| EBITDA | .0 | 15.1 | .0 | .0 | 38.3 | 31.9 | 53.8 | 90.6 | 152.6 | 257.2 |
| EBITDA, % | 0 | 56.74 | 0 | 0 | 38.52 | 19.05 | 19.05 | 19.05 | 19.05 | 19.05 |
| Depreciation | -4.1 | .0 | -27.3 | -33.5 | .0 | -53.9 | -90.8 | -153.1 | -257.9 | -434.5 |
| Depreciation, % | -31.34 | 0 | -64.31 | -65.3 | 0 | -32.19 | -32.19 | -32.19 | -32.19 | -32.19 |
| EBIT | 4.1 | 15.1 | 27.3 | 33.5 | 38.3 | 85.8 | 144.6 | 243.7 | 410.5 | 691.7 |
| EBIT, % | 31.34 | 56.74 | 64.31 | 65.3 | 38.52 | 51.24 | 51.24 | 51.24 | 51.24 | 51.24 |
| Total Cash | 59.3 | 86.4 | 48.7 | 13.2 | 18.1 | 115.2 | 194.1 | 327.0 | 551.0 | 928.3 |
| Total Cash, percent | .0 | .0 | .0 | .0 | .0 | .0 | .0 | .0 | .0 | .0 |
| Account Receivables | .0 | 6.3 | 6.3 | 6.1 | 2.0 | 17.6 | 29.6 | 49.9 | 84.0 | 141.6 |
| Account Receivables, % | 0 | 23.54 | 14.95 | 11.92 | 2.04 | 10.49 | 10.49 | 10.49 | 10.49 | 10.49 |
| Inventories | .0 | .0 | .0 | .0 | .0 | .0 | .0 | .0 | .0 | .0 |
| Inventories, % | 0 | 0 | 0 | 0 | 0 | 0 | 0 | 0 | 0 | 0 |
| Accounts Payable | 19.3 | 7.3 | 14.2 | 4.0 | 2.0 | 57.2 | 96.4 | 162.3 | 273.5 | 460.8 |
| Accounts Payable, % | 149.2 | 27.37 | 33.53 | 7.8 | 2 | 34.14 | 34.14 | 34.14 | 34.14 | 34.14 |
| Capital Expenditure | .0 | .0 | .0 | .0 | -22.1 | -7.4 | -12.5 | -21.1 | -35.6 | -60.0 |
| Capital Expenditure, % | 0 | 0 | 0 | 0 | -22.21 | -4.44 | -4.44 | -4.44 | -4.44 | -4.44 |
| Tax Rate, % | 0 | 0 | 0 | 0 | 0 | 0 | 0 | 0 | 0 | 0 |
| EBITAT | 4.1 | 15.1 | 27.3 | 33.5 | 38.3 | 85.8 | 144.6 | 243.7 | 410.5 | 691.7 |
| Depreciation | ||||||||||
| Changes in Account Receivables | ||||||||||
| Changes in Inventories | ||||||||||
| Changes in Accounts Payable | ||||||||||
| Capital Expenditure | ||||||||||
| UFCF | 19.3 | -3.2 | 6.9 | -10.0 | 18.3 | 64.1 | 68.4 | 115.2 | 194.1 | 327.0 |
| WACC, % | 4.99 | 4.99 | 4.99 | 4.99 | 4.99 | 4.99 | 4.99 | 4.99 | 4.99 | 4.99 |
| PV UFCF | ||||||||||
| SUM PV UFCF | 638.7 | |||||||||
| Long Term Growth Rate, % | 3.00 | |||||||||
| Free cash flow (T + 1) | 337 | |||||||||
| Terminal Value | 16,939 | |||||||||
| Present Terminal Value | 13,280 | |||||||||
| Enterprise Value | 13,919 | |||||||||
| Net Debt | 399 | |||||||||
| Equity Value | 13,520 | |||||||||
| Diluted Shares Outstanding, MM | 549 | |||||||||
| Equity Value Per Share | 2,461.47 |
What You Will Receive
- Authentic PRSRL Financial Data: Pre-loaded with PRS REIT plc’s historical and projected figures for accurate analysis.
- Completely Customizable Template: Easily adjust critical inputs such as rental growth, capitalization rate, and net operating income percentage.
- Instant Calculations: Watch PRS REIT plc’s intrinsic value update in real-time based on your modifications.
- Professional Valuation Tool: Tailored for investors, analysts, and consultants seeking reliable DCF results.
- User-Friendly Interface: Intuitive layout and straightforward guidelines suitable for all skill levels.
Key Features
- Comprehensive DCF Calculator: Features in-depth unlevered and levered DCF valuation models tailored for The PRS REIT plc (PRSRL).
- WACC Calculator: Ready-to-use Weighted Average Cost of Capital sheet with adjustable parameters.
- Customizable Forecast Assumptions: Easily adjust growth projections, capital expenditures, and discount rates.
- Integrated Financial Ratios: Evaluate profitability, leverage, and efficiency ratios specific to The PRS REIT plc (PRSRL).
- Interactive Dashboard and Charts: Visual representations that encapsulate essential valuation metrics for straightforward analysis.
How It Functions
- Download: Get the pre-formatted Excel file containing PRS REIT plc’s (PRSRL) financial data.
- Customize: Modify projections, including rental income growth, operating margin %, and discount rate.
- Update Automatically: Intrinsic value and NPV calculations refresh in real-time.
- Test Scenarios: Develop various forecasts and instantly compare the results.
- Make Decisions: Leverage the valuation insights to inform your investment approach.
Why Select The PRS REIT plc (PRSRL) Calculator?
- All-in-One Solution: Integrates DCF, WACC, and financial ratio assessments in a single tool.
- Flexible Parameters: Modify the yellow-highlighted fields to explore different scenarios.
- In-Depth Analysis: Automatically computes the intrinsic value and Net Present Value for The PRS REIT plc (PRSRL).
- Preloaded Information: Access to historical and projected data for precise calculations.
- High-Quality Output: Perfect for financial analysts, investors, and business consultants.
Who Can Benefit from This Product?
- Professional Investors: Create comprehensive and accurate valuation models for analyzing portfolios featuring PRS REIT plc (PRSRL).
- Corporate Finance Teams: Evaluate valuation scenarios to inform and shape corporate strategies involving PRS REIT plc (PRSRL).
- Consultants and Advisors: Deliver precise valuation insights to clients focused on investments in PRS REIT plc (PRSRL).
- Students and Educators: Utilize real-world data to enhance learning and practice in financial modeling with PRS REIT plc (PRSRL).
- Real Estate Enthusiasts: Gain insights into how real estate investment trusts like PRS REIT plc (PRSRL) are appraised in the marketplace.
Overview of the Template Features
- Comprehensive DCF Model: Editable template equipped with thorough valuation calculations.
- Real-World Data: Historical and projected financials for The PRS REIT plc (PRSRL) preloaded for your analysis.
- Customizable Parameters: Modify WACC, growth rates, and tax assumptions to explore various scenarios.
- Financial Statements: Complete annual and quarterly breakdowns for in-depth insights.
- Key Ratios: Integrated analysis of profitability, efficiency, and leverage metrics.
- Dashboard with Visual Outputs: Visualizations and tables that provide clear, actionable insights.
Disclaimer
All information, articles, and product details provided on this website are for general informational and educational purposes only. We do not claim any ownership over, nor do we intend to infringe upon, any trademarks, copyrights, logos, brand names, or other intellectual property mentioned or depicted on this site. Such intellectual property remains the property of its respective owners, and any references here are made solely for identification or informational purposes, without implying any affiliation, endorsement, or partnership.
We make no representations or warranties, express or implied, regarding the accuracy, completeness, or suitability of any content or products presented. Nothing on this website should be construed as legal, tax, investment, financial, medical, or other professional advice. In addition, no part of this site—including articles or product references—constitutes a solicitation, recommendation, endorsement, advertisement, or offer to buy or sell any securities, franchises, or other financial instruments, particularly in jurisdictions where such activity would be unlawful.
All content is of a general nature and may not address the specific circumstances of any individual or entity. It is not a substitute for professional advice or services. Any actions you take based on the information provided here are strictly at your own risk. You accept full responsibility for any decisions or outcomes arising from your use of this website and agree to release us from any liability in connection with your use of, or reliance upon, the content or products found herein.