
|
Quantumscape Corporation (QS) DCF Avaliação |
Totalmente Editável: Adapte-Se Às Suas Necessidades No Excel Ou Planilhas
Design Profissional: Modelos Confiáveis E Padrão Da Indústria
Pré-Construídos Para Uso Rápido E Eficiente
Compatível com MAC/PC, totalmente desbloqueado
Não É Necessária Experiência; Fácil De Seguir
QuantumScape Corporation (QS) Bundle
Simplifique sua análise e melhore a precisão com a nossa calculadora DCF (QS)! Equipado com dados reais da Quantumscape Corporation e suposições personalizáveis, essa ferramenta permite prever, analisar e avaliar (QS) como um investidor experiente.
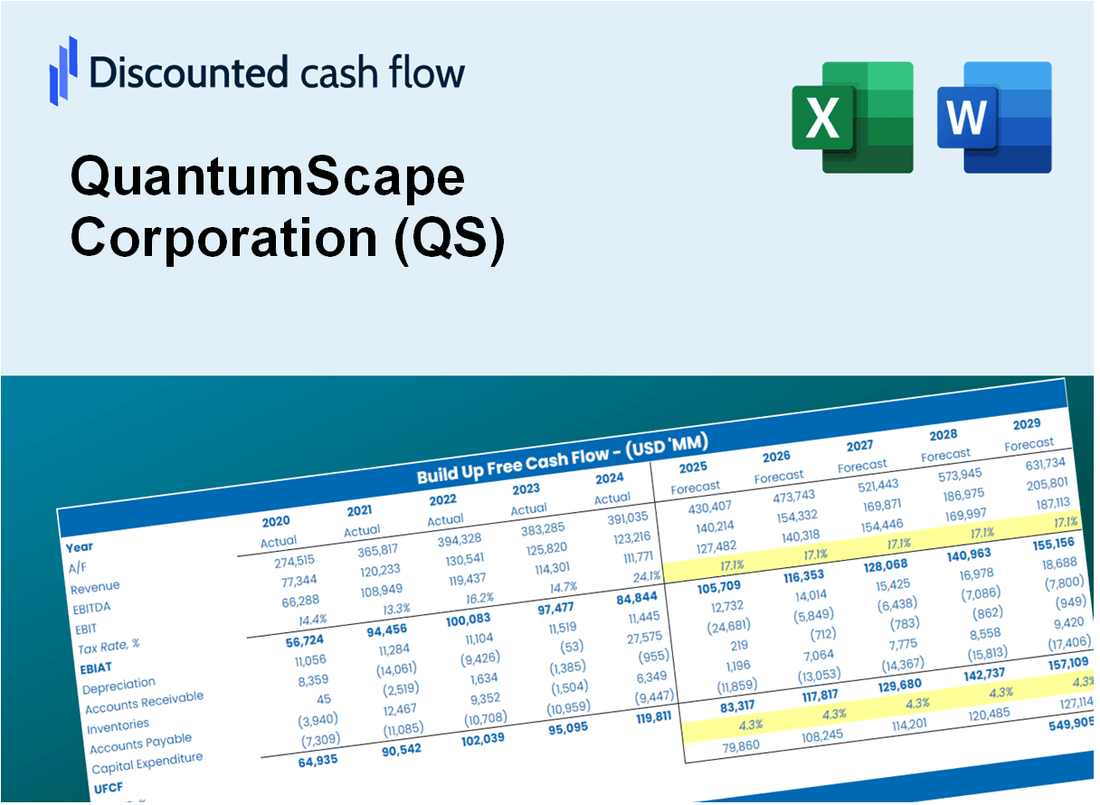
Discounted Cash Flow (DCF) - (USD MM)
| Year | AY1 2020 |
AY2 2021 |
AY3 2022 |
AY4 2023 |
AY5 2024 |
FY1 2025 |
FY2 2026 |
FY3 2027 |
FY4 2028 |
FY5 2029 |
|---|---|---|---|---|---|---|---|---|---|---|
| Revenue | .0 | .0 | .0 | .0 | .0 | .0 | .0 | .0 | .0 | .0 |
| Revenue Growth, % | 0 | 0 | 0 | 0 | 0 | 0 | 0 | 0 | 0 | 0 |
| EBITDA | -1,652.9 | -29.9 | -373.4 | -400.7 | -525.2 | .0 | .0 | .0 | .0 | .0 |
| EBITDA, % | 100 | 100 | 100 | 100 | 100 | 100 | 100 | 100 | 100 | 100 |
| Depreciation | 8.1 | 14.7 | 36.1 | 42.0 | -45.1 | .0 | .0 | .0 | .0 | .0 |
| Depreciation, % | 100 | 100 | 100 | 100 | 100 | 100 | 100 | 100 | 100 | 100 |
| EBIT | -1,661.0 | -44.6 | -409.5 | -442.7 | -480.1 | .0 | .0 | .0 | .0 | .0 |
| EBIT, % | 100 | 100 | 100 | 100 | 100 | 100 | 100 | 100 | 100 | 100 |
| Total Cash | 997.6 | 1,447.7 | 1,061.7 | 1,070.8 | 910.8 | .0 | .0 | .0 | .0 | .0 |
| Total Cash, percent | .0 | .0 | .0 | .0 | .0 | .0 | .0 | .0 | .0 | .0 |
| Account Receivables | .0 | .0 | .0 | .0 | .0 | .0 | .0 | .0 | .0 | .0 |
| Account Receivables, % | 100 | 100 | 100 | 100 | 100 | 100 | 100 | 100 | 100 | 100 |
| Inventories | .0 | .0 | .0 | .0 | .0 | .0 | .0 | .0 | .0 | .0 |
| Inventories, % | 100 | 100 | 100 | 100 | 100 | 100 | 100 | 100 | 100 | 100 |
| Accounts Payable | 5.4 | 14.2 | 21.4 | 13.0 | 6.5 | .0 | .0 | .0 | .0 | .0 |
| Accounts Payable, % | 100 | 100 | 100 | 100 | 100 | 100 | 100 | 100 | 100 | 100 |
| Capital Expenditure | -24.1 | -127.2 | -158.8 | -84.5 | -62.1 | .0 | .0 | .0 | .0 | .0 |
| Capital Expenditure, % | 100 | 100 | 100 | 100 | 100 | 0 | 0 | 0 | 0 | 0 |
| Tax Rate, % | 0 | 0 | 0 | 0 | 0 | 0 | 0 | 0 | 0 | 0 |
| EBITAT | -183.4 | -46.1 | -400.8 | -442.8 | -480.1 | .0 | .0 | .0 | .0 | .0 |
| Depreciation | ||||||||||
| Changes in Account Receivables | ||||||||||
| Changes in Inventories | ||||||||||
| Changes in Accounts Payable | ||||||||||
| Capital Expenditure | ||||||||||
| UFCF | -194.0 | -149.7 | -516.3 | -493.8 | -593.8 | -6.5 | .0 | .0 | .0 | .0 |
| WACC, % | 16.45 | 16.5 | 16.5 | 16.5 | 16.5 | 16.49 | 16.49 | 16.49 | 16.49 | 16.49 |
| PV UFCF | ||||||||||
| SUM PV UFCF | -5.6 | |||||||||
| Long Term Growth Rate, % | 2.00 | |||||||||
| Free cash flow (T + 1) | 0 | |||||||||
| Terminal Value | 0 | |||||||||
| Present Terminal Value | 0 | |||||||||
| Enterprise Value | -6 | |||||||||
| Net Debt | -47 | |||||||||
| Equity Value | 42 | |||||||||
| Diluted Shares Outstanding, MM | 508 | |||||||||
| Equity Value Per Share | 0.08 |
What You Will Get
- Editable Excel Template: A fully customizable Excel-based DCF Calculator featuring pre-filled real QS financials.
- Real-World Data: Historical data and forward-looking estimates (as indicated in the yellow cells).
- Forecast Flexibility: Adjust forecast assumptions such as revenue growth, EBITDA %, and WACC.
- Automatic Calculations: Instantly observe how your inputs affect QuantumScape’s valuation.
- Professional Tool: Designed for investors, CFOs, consultants, and financial analysts.
- User-Friendly Design: Organized for clarity and ease of use, complete with step-by-step instructions.
Key Features
- Pre-Loaded Data: QuantumScape Corporation’s historical financial statements and pre-filled forecasts.
- Fully Adjustable Inputs: Modify WACC, tax rates, revenue growth, and EBITDA margins as needed.
- Instant Results: Witness QuantumScape’s intrinsic value recalibrate in real time.
- Clear Visual Outputs: Dashboard charts illustrate valuation results and essential metrics.
- Built for Accuracy: A professional tool designed for analysts, investors, and finance professionals.
How It Works
- Step 1: Download the prebuilt Excel template featuring QuantumScape Corporation’s (QS) data.
- Step 2: Review the pre-filled sheets to grasp the essential metrics.
- Step 3: Modify forecasts and assumptions in the editable yellow cells (WACC, growth, margins).
- Step 4: Instantly see the recalculated results, including QuantumScape’s (QS) intrinsic value.
- Step 5: Make informed investment choices or create reports based on the outputs.
Why Choose This Calculator for QuantumScape (QS)?
- User-Friendly Interface: Perfectly suited for both novices and seasoned investors.
- Customizable Inputs: Adjust variables easily to tailor your financial analysis.
- Real-Time Valuation: Observe immediate updates to QuantumScape’s valuation as you modify inputs.
- Preloaded Data: Comes with QuantumScape’s actual financial metrics for efficient evaluation.
- Preferred by Experts: A go-to tool for investors and analysts seeking to make strategic choices.
Who Should Use This Product?
- Electric Vehicle Enthusiasts: Discover cutting-edge battery technologies and their implications for the future of transportation.
- Researchers: Utilize advanced models to study the impact of solid-state battery innovations on energy storage.
- Investors: Evaluate your investment strategies and analyze the potential of QuantumScape Corporation (QS) in the market.
- Industry Analysts: Enhance your reports with a customizable model focused on battery technology and its market effects.
- Startups in Clean Energy: Learn from the growth strategies of QuantumScape Corporation (QS) and apply insights to your own business.
What the Template Contains
- Comprehensive DCF Model: Editable template featuring in-depth valuation calculations.
- Real-World Data: QuantumScape's (QS) historical and projected financials preloaded for thorough analysis.
- Customizable Parameters: Modify WACC, growth rates, and tax assumptions to explore various scenarios.
- Financial Statements: Complete annual and quarterly breakdowns for enhanced insights.
- Key Ratios: Integrated analysis for profitability, efficiency, and leverage metrics.
- Dashboard with Visual Outputs: Charts and tables for clear, actionable results.
Disclaimer
All information, articles, and product details provided on this website are for general informational and educational purposes only. We do not claim any ownership over, nor do we intend to infringe upon, any trademarks, copyrights, logos, brand names, or other intellectual property mentioned or depicted on this site. Such intellectual property remains the property of its respective owners, and any references here are made solely for identification or informational purposes, without implying any affiliation, endorsement, or partnership.
We make no representations or warranties, express or implied, regarding the accuracy, completeness, or suitability of any content or products presented. Nothing on this website should be construed as legal, tax, investment, financial, medical, or other professional advice. In addition, no part of this site—including articles or product references—constitutes a solicitation, recommendation, endorsement, advertisement, or offer to buy or sell any securities, franchises, or other financial instruments, particularly in jurisdictions where such activity would be unlawful.
All content is of a general nature and may not address the specific circumstances of any individual or entity. It is not a substitute for professional advice or services. Any actions you take based on the information provided here are strictly at your own risk. You accept full responsibility for any decisions or outcomes arising from your use of this website and agree to release us from any liability in connection with your use of, or reliance upon, the content or products found herein.