
|
Avaliação DCF da Corporação QuickLogic (Quik) |
Totalmente Editável: Adapte-Se Às Suas Necessidades No Excel Ou Planilhas
Design Profissional: Modelos Confiáveis E Padrão Da Indústria
Pré-Construídos Para Uso Rápido E Eficiente
Compatível com MAC/PC, totalmente desbloqueado
Não É Necessária Experiência; Fácil De Seguir
QuickLogic Corporation (QUIK) Bundle
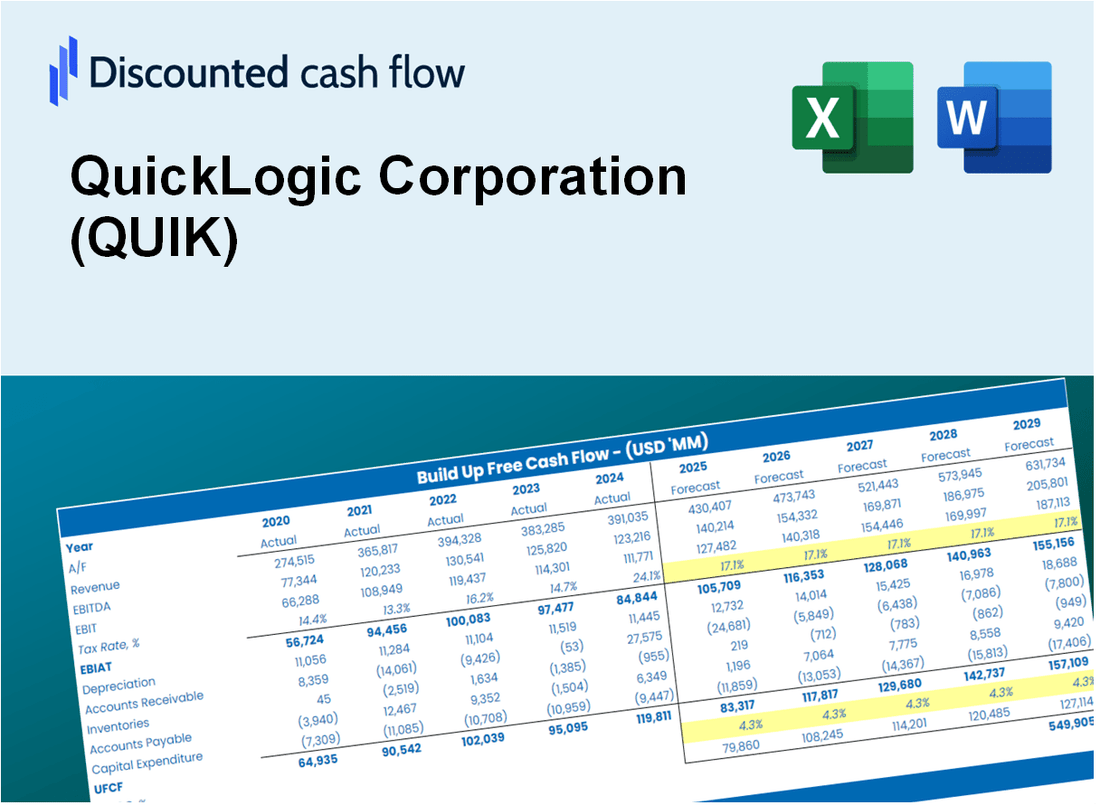
Procurando determinar o valor intrínseco da Corporação QuickLogic (Quik)? Nossa calculadora Quik DCF integra dados do mundo real com extensos recursos de personalização, permitindo ajustar as previsões e aprimorar suas estratégias de investimento.
Discounted Cash Flow (DCF) - (USD MM)
| Year | AY1 2020 |
AY2 2021 |
AY3 2022 |
AY4 2023 |
AY5 2024 |
FY1 2025 |
FY2 2026 |
FY3 2027 |
FY4 2028 |
FY5 2029 |
|---|---|---|---|---|---|---|---|---|---|---|
| Revenue | 8.6 | 12.7 | 16.2 | 21.2 | 20.1 | 25.2 | 31.5 | 39.4 | 49.2 | 61.6 |
| Revenue Growth, % | 0 | 46.92 | 27.55 | 31.01 | -5.12 | 25.09 | 25.09 | 25.09 | 25.09 | 25.09 |
| EBITDA | -9.4 | -6.8 | -3.1 | 2.2 | -.6 | -8.3 | -10.4 | -13.0 | -16.3 | -20.4 |
| EBITDA, % | -108.86 | -53.7 | -18.87 | 10.46 | -3.17 | -33.06 | -33.06 | -33.06 | -33.06 | -33.06 |
| Depreciation | .7 | .7 | .7 | 2.1 | 2.8 | 2.1 | 2.7 | 3.3 | 4.2 | 5.2 |
| Depreciation, % | 8.3 | 5.55 | 4.62 | 10.13 | 13.89 | 8.5 | 8.5 | 8.5 | 8.5 | 8.5 |
| EBIT | -10.1 | -7.5 | -3.8 | .1 | -3.4 | -10.0 | -12.6 | -15.7 | -19.6 | -24.6 |
| EBIT, % | -117.16 | -59.25 | -23.49 | 0.33022 | -17.06 | -39.89 | -39.89 | -39.89 | -39.89 | -39.89 |
| Total Cash | 22.7 | 19.6 | 19.2 | 24.6 | 21.9 | 25.2 | 31.5 | 39.4 | 49.2 | 61.6 |
| Total Cash, percent | .0 | .0 | .0 | .0 | .0 | .0 | .0 | .0 | .0 | .0 |
| Account Receivables | 1.7 | 1.3 | 4.7 | 6.4 | 5.1 | 5.8 | 7.2 | 9.0 | 11.3 | 14.1 |
| Account Receivables, % | 19.55 | 10.2 | 28.9 | 30.35 | 25.45 | 22.89 | 22.89 | 22.89 | 22.89 | 22.89 |
| Inventories | 2.7 | 2.1 | 2.5 | 2.0 | .9 | 3.9 | 4.9 | 6.1 | 7.6 | 9.5 |
| Inventories, % | 31.13 | 16.38 | 15.41 | 9.57 | 4.67 | 15.43 | 15.43 | 15.43 | 15.43 | 15.43 |
| Accounts Payable | .9 | .9 | 2.4 | 4.7 | 3.1 | 3.5 | 4.4 | 5.5 | 6.9 | 8.7 |
| Accounts Payable, % | 10.83 | 7.36 | 14.78 | 21.97 | 15.51 | 14.09 | 14.09 | 14.09 | 14.09 | 14.09 |
| Capital Expenditure | -1.1 | -.7 | -.8 | -6.3 | -6.5 | -4.3 | -5.3 | -6.7 | -8.4 | -10.5 |
| Capital Expenditure, % | -12.21 | -5.62 | -5.03 | -29.9 | -32.14 | -16.98 | -16.98 | -16.98 | -16.98 | -16.98 |
| Tax Rate, % | -0.07816571 | -0.07816571 | -0.07816571 | -0.07816571 | -0.07816571 | -0.07816571 | -0.07816571 | -0.07816571 | -0.07816571 | -0.07816571 |
| EBITAT | -10.2 | -7.7 | -3.9 | .1 | -3.4 | -10.0 | -12.6 | -15.7 | -19.6 | -24.6 |
| Depreciation | ||||||||||
| Changes in Account Receivables | ||||||||||
| Changes in Inventories | ||||||||||
| Changes in Accounts Payable | ||||||||||
| Capital Expenditure | ||||||||||
| UFCF | -13.9 | -6.7 | -6.3 | -3.1 | -6.2 | -15.3 | -16.8 | -21.0 | -26.2 | -32.8 |
| WACC, % | 6.86 | 6.86 | 6.86 | 6.86 | 6.86 | 6.86 | 6.86 | 6.86 | 6.86 | 6.86 |
| PV UFCF | ||||||||||
| SUM PV UFCF | -89.8 | |||||||||
| Long Term Growth Rate, % | 2.00 | |||||||||
| Free cash flow (T + 1) | -33 | |||||||||
| Terminal Value | -688 | |||||||||
| Present Terminal Value | -494 | |||||||||
| Enterprise Value | -584 | |||||||||
| Net Debt | 0 | |||||||||
| Equity Value | -584 | |||||||||
| Diluted Shares Outstanding, MM | 15 | |||||||||
| Equity Value Per Share | -40.24 |
What You Will Get
- Comprehensive QUIK Financials: Access to historical and projected data for precise valuation.
- Customizable Inputs: Adjust WACC, tax rates, revenue growth, and capital expenditures to fit your analysis.
- Real-Time Calculations: Intrinsic value and NPV are dynamically computed for you.
- Scenario Analysis: Explore various scenarios to assess QuickLogic's future performance.
- User-Friendly Design: Designed for professionals while remaining approachable for newcomers.
Key Features
- Comprehensive QUIK Data: Pre-loaded with QuickLogic's historical financial metrics and future projections.
- Customizable Financial Inputs: Modify revenue growth rates, profit margins, discount rates, tax percentages, and capital investments.
- Adaptive Valuation Model: Instantaneous updates to Net Present Value (NPV) and intrinsic value based on user-defined parameters.
- Scenario Analysis: Develop various forecasting scenarios to evaluate different valuation possibilities.
- Intuitive User Interface: Clean, organized design tailored for both experienced users and newcomers.
How It Works
- Download: Obtain the pre-prepared Excel file containing QuickLogic Corporation’s (QUIK) financial data.
- Customize: Modify key assumptions, such as revenue projections, gross margin %, and discount rates.
- Update Automatically: The intrinsic value and cash flow calculations refresh in real-time.
- Test Scenarios: Generate various forecasts and analyze different outcomes instantly.
- Make Decisions: Leverage the valuation results to inform your investment choices.
Why Choose This Calculator for QuickLogic Corporation (QUIK)?
- Accurate Data: Utilize authentic QuickLogic financials to ensure trustworthy valuation outcomes.
- Customizable: Modify essential parameters such as growth rates, WACC, and tax rates to align with your forecasts.
- Time-Saving: Built-in calculations save you from starting from scratch.
- Professional-Grade Tool: Tailored for investors, analysts, and consultants in the tech sector.
- User-Friendly: Easy-to-navigate design and clear instructions make it accessible for everyone.
Who Should Use QuickLogic Corporation (QUIK)?
- Investors: Gain insights and make informed decisions with advanced semiconductor solutions.
- Tech Analysts: Streamline your assessments using comprehensive data on innovative products.
- Consultants: Efficiently tailor presentations for clients with cutting-edge technology insights.
- Tech Enthusiasts: Enhance your knowledge of AI and low-power solutions through practical applications.
- Educators and Students: Utilize it as a resource for understanding the semiconductor industry in academic settings.
What the QuickLogic Template Contains
- Comprehensive DCF Model: Editable template with detailed valuation calculations tailored for QuickLogic Corporation (QUIK).
- Real-World Data: QuickLogic’s historical and projected financials preloaded for thorough analysis.
- Customizable Parameters: Adjust WACC, growth rates, and tax assumptions to explore various scenarios.
- Financial Statements: Complete annual and quarterly breakdowns for enhanced insights.
- Key Ratios: Integrated analysis for profitability, efficiency, and leverage metrics.
- Dashboard with Visual Outputs: Charts and tables to present clear, actionable results.
Disclaimer
All information, articles, and product details provided on this website are for general informational and educational purposes only. We do not claim any ownership over, nor do we intend to infringe upon, any trademarks, copyrights, logos, brand names, or other intellectual property mentioned or depicted on this site. Such intellectual property remains the property of its respective owners, and any references here are made solely for identification or informational purposes, without implying any affiliation, endorsement, or partnership.
We make no representations or warranties, express or implied, regarding the accuracy, completeness, or suitability of any content or products presented. Nothing on this website should be construed as legal, tax, investment, financial, medical, or other professional advice. In addition, no part of this site—including articles or product references—constitutes a solicitation, recommendation, endorsement, advertisement, or offer to buy or sell any securities, franchises, or other financial instruments, particularly in jurisdictions where such activity would be unlawful.
All content is of a general nature and may not address the specific circumstances of any individual or entity. It is not a substitute for professional advice or services. Any actions you take based on the information provided here are strictly at your own risk. You accept full responsibility for any decisions or outcomes arising from your use of this website and agree to release us from any liability in connection with your use of, or reliance upon, the content or products found herein.