
|
Ferrari N.V. (raça) Avaliação DCF |
Totalmente Editável: Adapte-Se Às Suas Necessidades No Excel Ou Planilhas
Design Profissional: Modelos Confiáveis E Padrão Da Indústria
Pré-Construídos Para Uso Rápido E Eficiente
Compatível com MAC/PC, totalmente desbloqueado
Não É Necessária Experiência; Fácil De Seguir
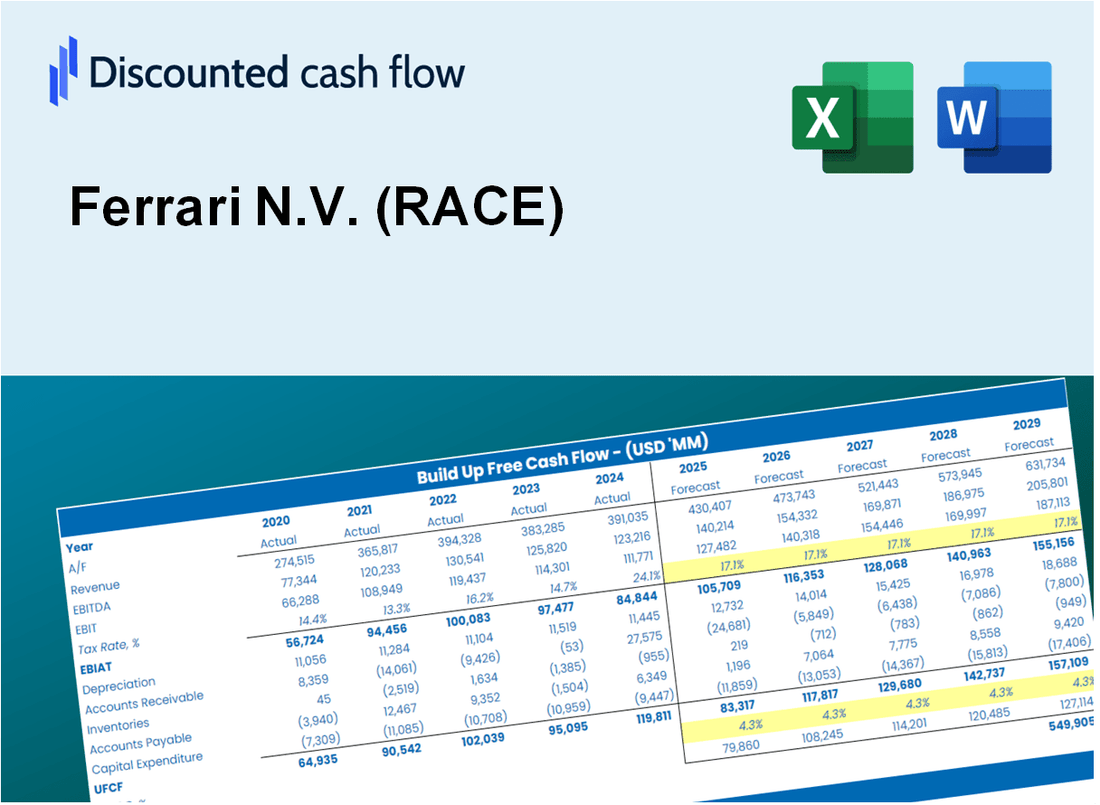
Ferrari N.V. (RACE) Bundle
Seja você um investidor ou analista, esta calculadora DCF (RACE) é sua ferramenta preferida para uma avaliação precisa. Equipado com dados reais da Ferrari N.V., você pode ajustar as previsões e observar os efeitos em tempo real.
Discounted Cash Flow (DCF) - (USD MM)
| Year | AY1 2020 |
AY2 2021 |
AY3 2022 |
AY4 2023 |
AY5 2024 |
FY1 2025 |
FY2 2026 |
FY3 2027 |
FY4 2028 |
FY5 2029 |
|---|---|---|---|---|---|---|---|---|---|---|
| Revenue | 4,021.6 | 4,964.4 | 5,922.6 | 6,939.6 | 7,760.9 | 9,153.0 | 10,794.8 | 12,731.1 | 15,014.8 | 17,708.1 |
| Revenue Growth, % | 0 | 23.44 | 19.3 | 17.17 | 11.83 | 17.94 | 17.94 | 17.94 | 17.94 | 17.94 |
| EBITDA | 1,324.2 | 1,778.1 | 2,059.8 | 2,667.3 | 3,015.6 | 3,310.0 | 3,903.7 | 4,603.9 | 5,429.8 | 6,403.8 |
| EBITDA, % | 32.93 | 35.82 | 34.78 | 38.44 | 38.86 | 36.16 | 36.16 | 36.16 | 36.16 | 36.16 |
| Depreciation | 495.9 | 530.0 | 634.9 | 769.9 | 775.1 | 1,003.3 | 1,183.3 | 1,395.5 | 1,645.9 | 1,941.1 |
| Depreciation, % | 12.33 | 10.68 | 10.72 | 11.09 | 9.99 | 10.96 | 10.96 | 10.96 | 10.96 | 10.96 |
| EBIT | 828.3 | 1,248.1 | 1,424.8 | 1,897.4 | 2,240.5 | 2,306.7 | 2,720.4 | 3,208.4 | 3,783.9 | 4,462.7 |
| EBIT, % | 20.6 | 25.14 | 24.06 | 27.34 | 28.87 | 25.2 | 25.2 | 25.2 | 25.2 | 25.2 |
| Total Cash | 1,585.3 | 1,564.7 | 1,622.7 | 1,310.6 | 2,031.7 | 2,625.1 | 3,096.0 | 3,651.3 | 4,306.3 | 5,078.7 |
| Total Cash, percent | .0 | .0 | .0 | .0 | .0 | .0 | .0 | .0 | .0 | .0 |
| Account Receivables | 1,357.6 | 1,632.6 | 2,009.0 | 2,080.3 | 2,421.9 | 2,960.9 | 3,492.1 | 4,118.5 | 4,857.2 | 5,728.5 |
| Account Receivables, % | 33.76 | 32.89 | 33.92 | 29.98 | 31.21 | 32.35 | 32.35 | 32.35 | 32.35 | 32.35 |
| Inventories | 535.4 | 628.4 | 784.2 | 1,102.5 | 1,264.9 | 1,307.0 | 1,541.4 | 1,817.9 | 2,144.0 | 2,528.6 |
| Inventories, % | 13.31 | 12.66 | 13.24 | 15.89 | 16.3 | 14.28 | 14.28 | 14.28 | 14.28 | 14.28 |
| Accounts Payable | 829.7 | 927.4 | 1,049.6 | 1,081.7 | 1,099.2 | 1,588.7 | 1,873.6 | 2,209.7 | 2,606.1 | 3,073.6 |
| Accounts Payable, % | 20.63 | 18.68 | 17.72 | 15.59 | 14.16 | 17.36 | 17.36 | 17.36 | 17.36 | 17.36 |
| Capital Expenditure | -824.1 | -856.8 | -935.3 | -1,010.0 | -1,149.8 | -1,517.8 | -1,790.1 | -2,111.2 | -2,489.8 | -2,936.5 |
| Capital Expenditure, % | -20.49 | -17.26 | -15.79 | -14.55 | -14.82 | -16.58 | -16.58 | -16.58 | -16.58 | -16.58 |
| Tax Rate, % | 19.43 | 19.43 | 19.43 | 19.43 | 19.43 | 19.43 | 19.43 | 19.43 | 19.43 | 19.43 |
| EBITAT | 754.8 | 994.9 | 1,128.3 | 1,482.6 | 1,805.1 | 1,885.6 | 2,223.8 | 2,622.7 | 3,093.1 | 3,648.0 |
| Depreciation | ||||||||||
| Changes in Account Receivables | ||||||||||
| Changes in Inventories | ||||||||||
| Changes in Accounts Payable | ||||||||||
| Capital Expenditure | ||||||||||
| UFCF | -636.7 | 397.7 | 417.9 | 884.9 | 944.0 | 1,279.4 | 1,136.4 | 1,340.3 | 1,580.7 | 1,864.2 |
| WACC, % | 6.52 | 6.5 | 6.5 | 6.5 | 6.5 | 6.51 | 6.51 | 6.51 | 6.51 | 6.51 |
| PV UFCF | ||||||||||
| SUM PV UFCF | 5,901.1 | |||||||||
| Long Term Growth Rate, % | 2.00 | |||||||||
| Free cash flow (T + 1) | 1,902 | |||||||||
| Terminal Value | 42,197 | |||||||||
| Present Terminal Value | 30,790 | |||||||||
| Enterprise Value | 36,691 | |||||||||
| Net Debt | 1,871 | |||||||||
| Equity Value | 34,820 | |||||||||
| Diluted Shares Outstanding, MM | 180 | |||||||||
| Equity Value Per Share | 193.45 |
What You Will Get
- Pre-Filled Financial Model: Ferrari N.V.’s actual data allows for accurate DCF valuation.
- Full Forecast Control: Modify revenue growth, profit margins, WACC, and other essential factors.
- Instant Calculations: Automatic updates provide immediate feedback as you adjust inputs.
- Investor-Ready Template: A polished Excel file crafted for high-quality valuation purposes.
- Customizable and Reusable: Designed for adaptability, enabling repeated use for comprehensive forecasts.
Key Features
- Customizable Performance Metrics: Adjust key inputs such as sales growth, profit margins, and investment levels.
- Instant DCF Valuation: Quickly computes intrinsic value, net present value, and other essential metrics.
- High-Precision Results: Leverages Ferrari's actual financial data for accurate valuation insights.
- Simple Scenario Analysis: Easily evaluate various assumptions and analyze different outcomes.
- Efficiency Booster: Remove the hassle of creating intricate valuation models from the ground up.
How It Works
- Download the Template: Get instant access to the Excel-based Ferrari DCF Calculator for Ferrari N.V. (RACE).
- Input Your Assumptions: Modify the yellow-highlighted cells for growth rates, WACC, margins, and other variables.
- Instant Calculations: The model automatically recalculates Ferrari’s intrinsic value.
- Test Scenarios: Experiment with various assumptions to assess potential valuation impacts.
- Analyze and Decide: Utilize the outcomes to inform your investment or financial analysis.
Why Choose This Calculator for Ferrari N.V. (RACE)?
- Designed for Experts: A sophisticated tool utilized by financial analysts, investment managers, and automotive consultants.
- Accurate Data: Ferrari’s historical and forecasted financials are preloaded for precision.
- Flexible Scenario Analysis: Effortlessly simulate various forecasts and assumptions.
- Comprehensive Outputs: Automatically calculates intrinsic value, NPV, and essential metrics.
- User-Friendly: Step-by-step guidance ensures a smooth experience.
Who Should Use This Product?
- Professional Investors: Create comprehensive and precise valuation models for analyzing Ferrari N.V. (RACE) investments.
- Corporate Finance Teams: Evaluate valuation scenarios to inform strategic decisions within their organizations.
- Consultants and Advisors: Deliver accurate valuation insights for clients interested in Ferrari N.V. (RACE) stock.
- Students and Educators: Utilize real-world data to enhance learning and practice in financial modeling.
- Automotive Enthusiasts: Gain insights into how luxury car manufacturers like Ferrari N.V. (RACE) are valued in the market.
What the Template Contains
- Pre-Filled DCF Model: Ferrari N.V.’s financial data preloaded for immediate use.
- WACC Calculator: Detailed calculations for Weighted Average Cost of Capital.
- Financial Ratios: Evaluate Ferrari N.V.’s profitability, leverage, and efficiency.
- Editable Inputs: Change assumptions such as growth, margins, and CAPEX to fit your scenarios.
- Financial Statements: Annual and quarterly reports to support detailed analysis.
- Interactive Dashboard: Easily visualize key valuation metrics and results.
Disclaimer
All information, articles, and product details provided on this website are for general informational and educational purposes only. We do not claim any ownership over, nor do we intend to infringe upon, any trademarks, copyrights, logos, brand names, or other intellectual property mentioned or depicted on this site. Such intellectual property remains the property of its respective owners, and any references here are made solely for identification or informational purposes, without implying any affiliation, endorsement, or partnership.
We make no representations or warranties, express or implied, regarding the accuracy, completeness, or suitability of any content or products presented. Nothing on this website should be construed as legal, tax, investment, financial, medical, or other professional advice. In addition, no part of this site—including articles or product references—constitutes a solicitation, recommendation, endorsement, advertisement, or offer to buy or sell any securities, franchises, or other financial instruments, particularly in jurisdictions where such activity would be unlawful.
All content is of a general nature and may not address the specific circumstances of any individual or entity. It is not a substitute for professional advice or services. Any actions you take based on the information provided here are strictly at your own risk. You accept full responsibility for any decisions or outcomes arising from your use of this website and agree to release us from any liability in connection with your use of, or reliance upon, the content or products found herein.