
|
Rit Capital Partners PLC (RCP.L) DCF Avaliação |
Totalmente Editável: Adapte-Se Às Suas Necessidades No Excel Ou Planilhas
Design Profissional: Modelos Confiáveis E Padrão Da Indústria
Pré-Construídos Para Uso Rápido E Eficiente
Compatível com MAC/PC, totalmente desbloqueado
Não É Necessária Experiência; Fácil De Seguir
RIT Capital Partners plc (RCP.L) Bundle
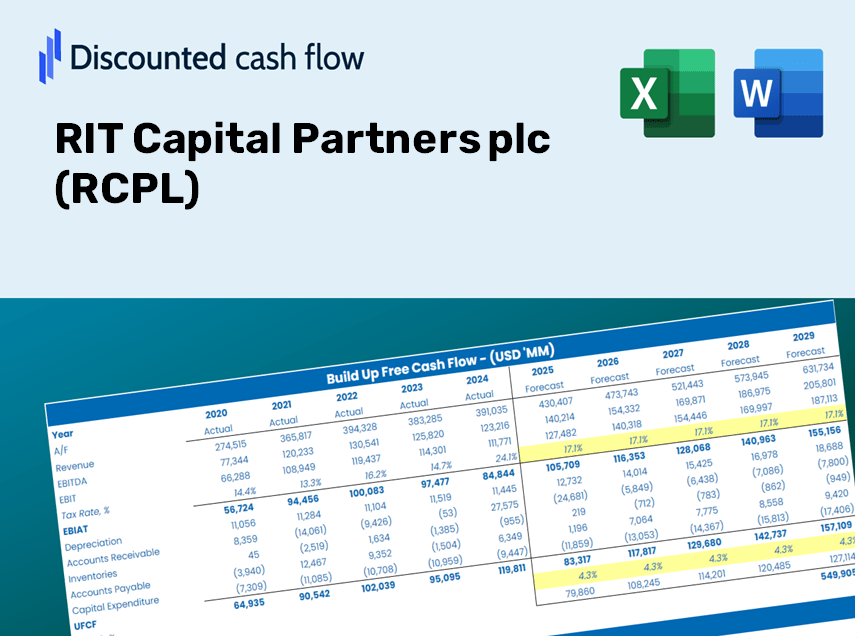
Projetado para precisão, a nossa calculadora DCF (RCPL) capacita a avaliação da Rit Capital Partners PLC usando dados financeiros em tempo real, permitindo flexibilidade completa para modificar todos os parâmetros essenciais para projeções aprimoradas.
Discounted Cash Flow (DCF) - (USD MM)
| Year | AY1 2020 |
AY2 2021 |
AY3 2022 |
AY4 2023 |
AY5 2024 |
FY1 2025 |
FY2 2026 |
FY3 2027 |
FY4 2028 |
FY5 2029 |
|---|---|---|---|---|---|---|---|---|---|---|
| Revenue | 541.2 | 916.3 | 26.7 | 32.5 | 375.3 | 463.4 | 572.3 | 706.7 | 872.7 | 1,077.6 |
| Revenue Growth, % | 0 | 69.31 | -97.09 | 21.72 | 1054.77 | 23.49 | 23.49 | 23.49 | 23.49 | 23.49 |
| EBITDA | 498.2 | 864.2 | -572.3 | 100.0 | 337.1 | 256.0 | 316.1 | 390.4 | 482.1 | 595.3 |
| EBITDA, % | 92.05 | 94.31 | -2143.45 | 307.69 | 89.82 | 55.24 | 55.24 | 55.24 | 55.24 | 55.24 |
| Depreciation | .4 | .3 | .4 | .3 | .3 | 2.4 | 3.0 | 3.7 | 4.6 | 5.6 |
| Depreciation, % | 0.07390983 | 0.03274037 | 1.5 | 0.92308 | 0.07993605 | 0.52156 | 0.52156 | 0.52156 | 0.52156 | 0.52156 |
| EBIT | 497.8 | 863.9 | -572.7 | 99.7 | 336.8 | 255.8 | 315.9 | 390.1 | 481.7 | 594.9 |
| EBIT, % | 91.98 | 94.28 | -2144.94 | 306.77 | 89.74 | 55.2 | 55.2 | 55.2 | 55.2 | 55.2 |
| Total Cash | 296.8 | 325.9 | 218.0 | 204.3 | 189.4 | 316.0 | 390.2 | 481.8 | 594.9 | 734.7 |
| Total Cash, percent | .0 | .0 | .0 | .0 | .0 | .0 | .0 | .0 | .0 | .0 |
| Account Receivables | 39.8 | 123.6 | 157.4 | 29.3 | 4.6 | 196.7 | 242.9 | 300.0 | 370.4 | 457.4 |
| Account Receivables, % | 7.35 | 13.49 | 589.51 | 90.15 | 1.23 | 42.44 | 42.44 | 42.44 | 42.44 | 42.44 |
| Inventories | .0 | .0 | .0 | -5.5 | .0 | -15.7 | -19.4 | -23.9 | -29.5 | -36.5 |
| Inventories, % | 0 | 0 | 0 | -16.92 | 0 | -3.38 | -3.38 | -3.38 | -3.38 | -3.38 |
| Accounts Payable | 3.1 | 99.9 | 24.1 | 2.7 | 43.2 | 112.7 | 139.1 | 171.8 | 212.2 | 262.0 |
| Accounts Payable, % | 0.5728 | 10.9 | 90.26 | 8.31 | 11.51 | 24.31 | 24.31 | 24.31 | 24.31 | 24.31 |
| Capital Expenditure | -.2 | -.1 | -.1 | -.3 | -.1 | -1.3 | -1.6 | -1.9 | -2.4 | -3.0 |
| Capital Expenditure, % | -0.03695492 | -0.01091346 | -0.37453 | -0.92308 | -0.02664535 | -0.27442 | -0.27442 | -0.27442 | -0.27442 | -0.27442 |
| Tax Rate, % | 0 | 0 | 0 | 0 | 0 | 0 | 0 | 0 | 0 | 0 |
| EBITAT | 498.7 | 861.2 | -572.7 | 99.7 | 336.8 | 255.7 | 315.7 | 389.9 | 481.4 | 594.5 |
| Depreciation | ||||||||||
| Changes in Account Receivables | ||||||||||
| Changes in Inventories | ||||||||||
| Changes in Accounts Payable | ||||||||||
| Capital Expenditure | ||||||||||
| UFCF | 462.2 | 874.4 | -682.0 | 211.9 | 396.7 | 149.9 | 301.1 | 371.8 | 459.1 | 566.9 |
| WACC, % | 5.83 | 5.83 | 5.83 | 5.83 | 5.83 | 5.83 | 5.83 | 5.83 | 5.83 | 5.83 |
| PV UFCF | ||||||||||
| SUM PV UFCF | 1,517.2 | |||||||||
| Long Term Growth Rate, % | 4.00 | |||||||||
| Free cash flow (T + 1) | 590 | |||||||||
| Terminal Value | 32,231 | |||||||||
| Present Terminal Value | 24,280 | |||||||||
| Enterprise Value | 25,797 | |||||||||
| Net Debt | -189 | |||||||||
| Equity Value | 25,987 | |||||||||
| Diluted Shares Outstanding, MM | 145 | |||||||||
| Equity Value Per Share | 17,909.50 |
What You Will Receive
- Authentic RIT Financial Data: Pre-populated with RIT Capital Partners plc’s historical and projected figures for precise analysis.
- Completely Customizable Template: Effortlessly adjust key inputs such as revenue growth, WACC, and EBITDA %.
- Instant Calculations: Track RIT’s intrinsic value in real-time as you make changes.
- Professional Valuation Tool: Tailored for investors, analysts, and consultants pursuing accurate DCF outcomes.
- User-Centric Layout: Intuitive design and clear guidance suitable for all skill levels.
Key Features
- Pre-Loaded Data: RIT Capital Partners plc's (RCPL) historical financial records and pre-filled projections.
- Fully Adjustable Inputs: Customize WACC, tax rates, revenue growth, and EBITDA margins as needed.
- Instant Results: Watch RIT Capital Partners plc's (RCPL) intrinsic value update in real time.
- Clear Visual Outputs: Interactive dashboard charts reveal valuation results and essential metrics.
- Built for Accuracy: A professional-grade tool designed for analysts, investors, and finance professionals.
How It Functions
- Download the Template: Gain immediate access to the Excel-based RIT Capital Partners plc (RCPL) DCF Calculator.
- Input Your Assumptions: Modify the yellow-highlighted cells to set your growth rates, WACC, margins, and other parameters.
- Instant Calculations: The model automatically recalculates the intrinsic value of RIT Capital Partners plc (RCPL).
- Test Scenarios: Experiment with various assumptions to see how they affect valuation outcomes.
- Analyze and Decide: Leverage the findings to inform your investment or financial strategies.
Why Opt for Our Calculator?
- Precision: Leveraging accurate financial data from RIT Capital Partners (RCPL) guarantees reliable results.
- Versatility: Crafted to allow users to easily adjust and experiment with inputs.
- Efficiency: Eliminate the tedious process of constructing a DCF model from scratch.
- Expert-Quality: Designed with the expertise and functionality expected at the CFO level.
- Intuitive: Simple to navigate, making it accessible for those new to financial modeling.
Who Can Benefit from RIT Capital Partners plc (RCPL)?
- Investors: Gain confidence in your investment choices with a professional-grade valuation tool.
- Financial Analysts: Streamline your workflow with a customizable pre-built DCF model.
- Consultants: Effortlessly tailor the template for presentations or reports for your clients.
- Finance Enthusiasts: Enhance your knowledge of valuation methods through practical, real-world examples.
- Educators and Students: Utilize it as an effective learning resource in finance-related studies.
Contents of the Template
- Historical Data: Comprises RIT Capital Partners plc’s (RCPL) previous financial performance and foundational forecasts.
- DCF and Levered DCF Models: Comprehensive templates for calculating the intrinsic value of RIT Capital Partners plc (RCPL).
- WACC Sheet: Preconfigured calculations for the Weighted Average Cost of Capital.
- Editable Inputs: Customize essential drivers such as growth rates, EBITDA %, and CAPEX assumptions.
- Quarterly and Annual Statements: A thorough analysis of RIT Capital Partners plc’s (RCPL) financials.
- Interactive Dashboard: Dynamically visualize valuation outcomes and forecasts.
Disclaimer
All information, articles, and product details provided on this website are for general informational and educational purposes only. We do not claim any ownership over, nor do we intend to infringe upon, any trademarks, copyrights, logos, brand names, or other intellectual property mentioned or depicted on this site. Such intellectual property remains the property of its respective owners, and any references here are made solely for identification or informational purposes, without implying any affiliation, endorsement, or partnership.
We make no representations or warranties, express or implied, regarding the accuracy, completeness, or suitability of any content or products presented. Nothing on this website should be construed as legal, tax, investment, financial, medical, or other professional advice. In addition, no part of this site—including articles or product references—constitutes a solicitation, recommendation, endorsement, advertisement, or offer to buy or sell any securities, franchises, or other financial instruments, particularly in jurisdictions where such activity would be unlawful.
All content is of a general nature and may not address the specific circumstances of any individual or entity. It is not a substitute for professional advice or services. Any actions you take based on the information provided here are strictly at your own risk. You accept full responsibility for any decisions or outcomes arising from your use of this website and agree to release us from any liability in connection with your use of, or reliance upon, the content or products found herein.