
|
Varejo Estates N.V. (Ret.Br) Avaliação DCF |
Totalmente Editável: Adapte-Se Às Suas Necessidades No Excel Ou Planilhas
Design Profissional: Modelos Confiáveis E Padrão Da Indústria
Pré-Construídos Para Uso Rápido E Eficiente
Compatível com MAC/PC, totalmente desbloqueado
Não É Necessária Experiência; Fácil De Seguir
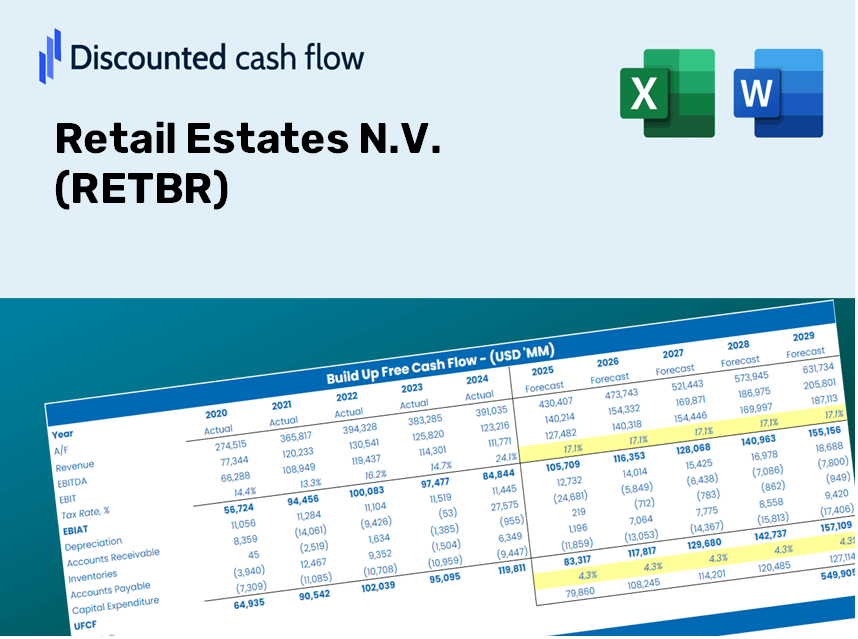
Retail Estates N.V. (RET.BR) Bundle
Descubra todo o potencial das propriedades de varejo N.V. (RETBR) com nossa calculadora DCF avançada! Ajuste as suposições essenciais, explore vários cenários e avalie como diferentes mudanças afetam as propriedades de varejo N.V. (RETBR) Avaliação - tudo em um modelo abrangente do Excel.
Discounted Cash Flow (DCF) - (USD MM)
| Year | AY1 2020 |
AY2 2021 |
AY3 2022 |
AY4 2023 |
AY5 2024 |
FY1 2025 |
FY2 2026 |
FY3 2027 |
FY4 2028 |
FY5 2029 |
|---|---|---|---|---|---|---|---|---|---|---|
| Revenue | 113.2 | 127.7 | 138.9 | 154.1 | 140.6 | 149.0 | 157.8 | 167.2 | 177.1 | 187.6 |
| Revenue Growth, % | 0 | 12.84 | 8.71 | 11 | -8.79 | 5.94 | 5.94 | 5.94 | 5.94 | 5.94 |
| EBITDA | 84.8 | 130.8 | 138.9 | 146.8 | 117.1 | 135.1 | 143.1 | 151.6 | 160.6 | 170.2 |
| EBITDA, % | 74.94 | 102.4 | 100.02 | 95.24 | 83.32 | 90.7 | 90.7 | 90.7 | 90.7 | 90.7 |
| Depreciation | .4 | .7 | .8 | 1.2 | 1.2 | .9 | 1.0 | 1.1 | 1.1 | 1.2 |
| Depreciation, % | 0.35953 | 0.55349 | 0.56891 | 0.80705 | 0.8848 | 0.63475 | 0.63475 | 0.63475 | 0.63475 | 0.63475 |
| EBIT | 84.4 | 130.1 | 138.1 | 145.6 | 115.9 | 134.3 | 142.3 | 150.8 | 159.7 | 169.2 |
| EBIT, % | 74.58 | 101.85 | 99.45 | 94.43 | 82.43 | 90.18 | 90.18 | 90.18 | 90.18 | 90.18 |
| Total Cash | 3.7 | 1.5 | 4.1 | 7.1 | 2.9 | 4.2 | 4.4 | 4.7 | 5.0 | 5.3 |
| Total Cash, percent | .0 | .0 | .0 | .0 | .0 | .0 | .0 | .0 | .0 | .0 |
| Account Receivables | 6.8 | 2.1 | 11.4 | 14.6 | 15.5 | 10.8 | 11.5 | 12.2 | 12.9 | 13.7 |
| Account Receivables, % | 6.04 | 1.62 | 8.24 | 9.49 | 11.01 | 7.28 | 7.28 | 7.28 | 7.28 | 7.28 |
| Inventories | .1 | .0 | .0 | .0 | .0 | .0 | .0 | .0 | .0 | .0 |
| Inventories, % | 0.05211876 | 0.01722302 | 0 | 0 | 0.0120913 | 0.01628662 | 0.01628662 | 0.01628662 | 0.01628662 | 0.01628662 |
| Accounts Payable | .7 | .0 | .2 | .8 | .3 | .4 | .5 | .5 | .5 | .6 |
| Accounts Payable, % | 0.58214 | 0.00156573 | 0.17643 | 0.50213 | 0.24609 | 0.30167 | 0.30167 | 0.30167 | 0.30167 | 0.30167 |
| Capital Expenditure | -.8 | -3.3 | -3.1 | -4.0 | -1.2 | -2.6 | -2.8 | -3.0 | -3.1 | -3.3 |
| Capital Expenditure, % | -0.67401 | -2.55 | -2.21 | -2.62 | -0.82505 | -1.78 | -1.78 | -1.78 | -1.78 | -1.78 |
| Tax Rate, % | 3.73 | 3.73 | 3.73 | 3.73 | 3.73 | 3.73 | 3.73 | 3.73 | 3.73 | 3.73 |
| EBITAT | 81.3 | 126.9 | 142.3 | 144.5 | 111.6 | 131.4 | 139.3 | 147.5 | 156.3 | 165.6 |
| Depreciation | ||||||||||
| Changes in Account Receivables | ||||||||||
| Changes in Inventories | ||||||||||
| Changes in Accounts Payable | ||||||||||
| Capital Expenditure | ||||||||||
| UFCF | 74.7 | 128.5 | 131.0 | 139.0 | 110.4 | 134.5 | 136.8 | 145.0 | 153.6 | 162.7 |
| WACC, % | 5.33 | 5.35 | 5.4 | 5.38 | 5.33 | 5.36 | 5.36 | 5.36 | 5.36 | 5.36 |
| PV UFCF | ||||||||||
| SUM PV UFCF | 624.8 | |||||||||
| Long Term Growth Rate, % | 1.00 | |||||||||
| Free cash flow (T + 1) | 164 | |||||||||
| Terminal Value | 3,770 | |||||||||
| Present Terminal Value | 2,904 | |||||||||
| Enterprise Value | 3,529 | |||||||||
| Net Debt | 888 | |||||||||
| Equity Value | 2,642 | |||||||||
| Diluted Shares Outstanding, MM | 15 | |||||||||
| Equity Value Per Share | 179.62 |
What You Will Receive
- Customizable Excel Template: A fully adaptable Excel-based DCF Calculator featuring pre-populated financial data for Retail Estates N.V. (RETBR).
- Real-World Financial Data: Access to historical performance metrics and forward-looking projections (highlighted in the yellow cells).
- Forecasting Flexibility: Modify key assumptions such as rental income growth, net operating income percentage, and discount rate.
- Instant Calculations: Quickly observe how your inputs affect the valuation of Retail Estates N.V. (RETBR).
- Professional Grade Tool: Designed for investors, CFOs, consultants, and financial analysts.
- User-Friendly Format: Organized for straightforward navigation, accompanied by step-by-step guidance.
Key Features
- Customizable Forecast Inputs: Adjust vital parameters such as rental income growth, occupancy rates, and maintenance expenses.
- Instant DCF Valuation: Automatically computes intrinsic value, NPV, and additional financial metrics.
- High-Precision Accuracy: Relies on Retail Estates N.V. (RETBR)’s actual financial data for dependable valuation results.
- Simplified Scenario Analysis: Easily evaluate various assumptions and analyze their impacts on outcomes.
- Efficiency Booster: Remove the hassle of creating elaborate valuation models from the ground up.
How It Works
- Download: Obtain the pre-configured Excel file containing Retail Estates N.V.'s (RETBR) financial data.
- Customize: Modify forecasts such as revenue growth, EBITDA percentage, and WACC to fit your analysis.
- Update Automatically: Experience real-time updates for intrinsic value and NPV calculations as you make changes.
- Test Scenarios: Develop various projections and instantly evaluate different outcomes.
- Make Decisions: Leverage the valuation insights to shape your investment strategy.
Why Opt for This Calculator?
- Precision: Utilizes verified data from Retail Estates N.V. (RETBR) for reliable calculations.
- Adaptability: Built for users to easily adjust and experiment with various inputs.
- Efficiency: Eliminate the tedious process of creating a DCF model from the ground up.
- Expert-Level Quality: Crafted with the accuracy and functionality expected at the CFO level.
- Intuitive Interface: Simple to navigate, even for those lacking extensive financial modeling skills.
Who Can Benefit from This Product?
- Real Estate Students: Discover property valuation methods and apply them to real-world scenarios.
- Researchers: Integrate industry-standard models into your studies or academic projects.
- Investors: Validate your investment strategies by analyzing the valuation of Retail Estates N.V. (RETBR).
- Market Analysts: Enhance your analytical process with a ready-to-use, customizable DCF model.
- Property Entrepreneurs: Learn how major real estate companies like Retail Estates N.V. (RETBR) are evaluated.
Contents of the Template
- Pre-Filled DCF Model: Retail Estates N.V. (RETBR) financial data included for immediate application.
- WACC Calculator: Comprehensive calculations for Weighted Average Cost of Capital.
- Financial Ratios: Assess Retail Estates N.V.’s profitability, leverage, and operational efficiency.
- Editable Inputs: Adjust variables such as growth rates, profit margins, and capital expenditures to match your scenarios.
- Financial Statements: Annual and quarterly reports for in-depth analysis.
- Interactive Dashboard: Conveniently visualize essential valuation metrics and outcomes.
Disclaimer
All information, articles, and product details provided on this website are for general informational and educational purposes only. We do not claim any ownership over, nor do we intend to infringe upon, any trademarks, copyrights, logos, brand names, or other intellectual property mentioned or depicted on this site. Such intellectual property remains the property of its respective owners, and any references here are made solely for identification or informational purposes, without implying any affiliation, endorsement, or partnership.
We make no representations or warranties, express or implied, regarding the accuracy, completeness, or suitability of any content or products presented. Nothing on this website should be construed as legal, tax, investment, financial, medical, or other professional advice. In addition, no part of this site—including articles or product references—constitutes a solicitation, recommendation, endorsement, advertisement, or offer to buy or sell any securities, franchises, or other financial instruments, particularly in jurisdictions where such activity would be unlawful.
All content is of a general nature and may not address the specific circumstances of any individual or entity. It is not a substitute for professional advice or services. Any actions you take based on the information provided here are strictly at your own risk. You accept full responsibility for any decisions or outcomes arising from your use of this website and agree to release us from any liability in connection with your use of, or reliance upon, the content or products found herein.