
|
Regiões Financial Corporation (RF) Avaliação DCF |
Totalmente Editável: Adapte-Se Às Suas Necessidades No Excel Ou Planilhas
Design Profissional: Modelos Confiáveis E Padrão Da Indústria
Pré-Construídos Para Uso Rápido E Eficiente
Compatível com MAC/PC, totalmente desbloqueado
Não É Necessária Experiência; Fácil De Seguir
Regions Financial Corporation (RF) Bundle
Explore as perspectivas financeiras da Regiões Financial Corporation (RF) com nossa calculadora DCF! Digite suas projeções de crescimento, margens e despesas para determinar o valor intrínseco da Regiões Financial Corporation (RF) e refine sua abordagem de investimento.
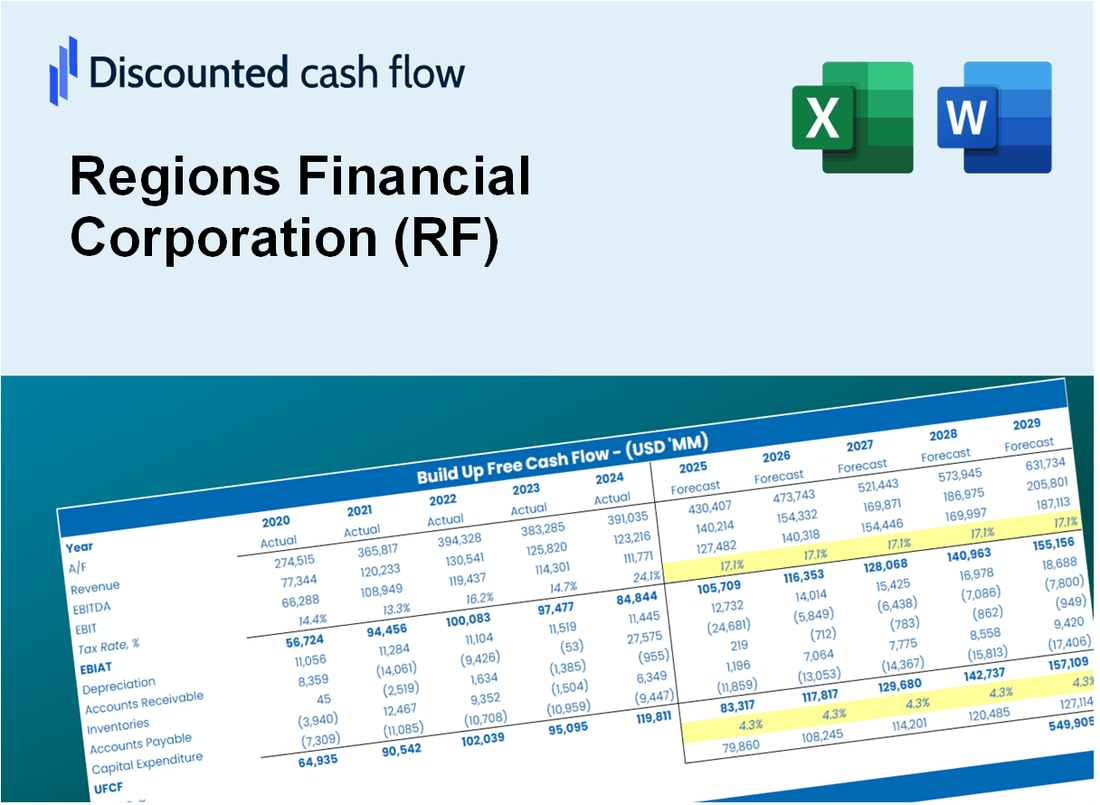
Discounted Cash Flow (DCF) - (USD MM)
| Year | AY1 2020 |
AY2 2021 |
AY3 2022 |
AY4 2023 |
AY5 2024 |
FY1 2025 |
FY2 2026 |
FY3 2027 |
FY4 2028 |
FY5 2029 |
|---|---|---|---|---|---|---|---|---|---|---|
| Revenue | 6,643.0 | 6,603.0 | 7,481.0 | 9,153.0 | 9,373.0 | 10,250.5 | 11,210.2 | 12,259.7 | 13,407.4 | 14,662.7 |
| Revenue Growth, % | 0 | -0.60214 | 13.3 | 22.35 | 2.4 | 9.36 | 9.36 | 9.36 | 9.36 | 9.36 |
| EBITDA | 1,735.0 | 3,586.0 | 3,229.0 | 2,843.0 | 2,498.0 | 3,716.9 | 4,064.8 | 4,445.4 | 4,861.6 | 5,316.7 |
| EBITDA, % | 26.12 | 54.31 | 43.16 | 31.06 | 26.65 | 36.26 | 36.26 | 36.26 | 36.26 | 36.26 |
| Depreciation | 421.0 | 371.0 | 353.0 | 236.0 | 144.0 | 426.2 | 466.1 | 509.7 | 557.5 | 609.7 |
| Depreciation, % | 6.34 | 5.62 | 4.72 | 2.58 | 1.54 | 4.16 | 4.16 | 4.16 | 4.16 | 4.16 |
| EBIT | 1,314.0 | 3,215.0 | 2,876.0 | 2,607.0 | 2,354.0 | 3,290.6 | 3,598.7 | 3,935.6 | 4,304.1 | 4,707.0 |
| EBIT, % | 19.78 | 48.69 | 38.44 | 28.48 | 25.11 | 32.1 | 32.1 | 32.1 | 32.1 | 32.1 |
| Total Cash | 45,110.0 | 57,892.0 | 39,160.0 | 34,905.0 | 34,155.0 | 10,250.5 | 11,210.2 | 12,259.7 | 13,407.4 | 14,662.7 |
| Total Cash, percent | .0 | .0 | .0 | .0 | .0 | .0 | .0 | .0 | .0 | .0 |
| Account Receivables | 346.0 | 319.0 | 511.0 | 614.0 | 572.0 | 608.5 | 665.5 | 727.8 | 795.9 | 870.4 |
| Account Receivables, % | 5.21 | 4.83 | 6.83 | 6.71 | 6.1 | 5.94 | 5.94 | 5.94 | 5.94 | 5.94 |
| Inventories | .0 | .0 | .0 | .0 | .0 | .0 | .0 | .0 | .0 | .0 |
| Inventories, % | 0 | 0 | 0 | 0 | 0 | 0 | 0 | 0 | 0 | 0 |
| Accounts Payable | .0 | .0 | .0 | .0 | .0 | .0 | .0 | .0 | .0 | .0 |
| Accounts Payable, % | 0 | 0 | 0 | 0 | 0 | 0 | 0 | 0 | 0 | 0 |
| Capital Expenditure | -59.0 | -72.0 | -288.0 | -157.0 | -146.0 | -186.6 | -204.1 | -223.2 | -244.0 | -266.9 |
| Capital Expenditure, % | -0.88815 | -1.09 | -3.85 | -1.72 | -1.56 | -1.82 | -1.82 | -1.82 | -1.82 | -1.82 |
| Tax Rate, % | 19.58 | 19.58 | 19.58 | 19.58 | 19.58 | 19.58 | 19.58 | 19.58 | 19.58 | 19.58 |
| EBITAT | 1,094.0 | 2,521.0 | 2,245.0 | 2,074.0 | 1,893.0 | 2,630.6 | 2,876.8 | 3,146.2 | 3,440.7 | 3,762.8 |
| Depreciation | ||||||||||
| Changes in Account Receivables | ||||||||||
| Changes in Inventories | ||||||||||
| Changes in Accounts Payable | ||||||||||
| Capital Expenditure | ||||||||||
| UFCF | 1,110.0 | 2,847.0 | 2,118.0 | 2,050.0 | 1,933.0 | 2,833.7 | 3,081.9 | 3,370.5 | 3,686.0 | 4,031.1 |
| WACC, % | 13.27 | 12.9 | 12.87 | 12.99 | 13.05 | 13.02 | 13.02 | 13.02 | 13.02 | 13.02 |
| PV UFCF | ||||||||||
| SUM PV UFCF | 11,700.9 | |||||||||
| Long Term Growth Rate, % | 2.00 | |||||||||
| Free cash flow (T + 1) | 4,112 | |||||||||
| Terminal Value | 37,325 | |||||||||
| Present Terminal Value | 20,244 | |||||||||
| Enterprise Value | 31,945 | |||||||||
| Net Debt | -4,219 | |||||||||
| Equity Value | 36,164 | |||||||||
| Diluted Shares Outstanding, MM | 918 | |||||||||
| Equity Value Per Share | 39.39 |
What You Will Get
- Real Regions Financial Data: Preloaded financials – from revenue to EBIT – based on actual and projected figures.
- Full Customization: Adjust all critical parameters (yellow cells) like WACC, growth %, and tax rates.
- Instant Valuation Updates: Automatic recalculations to analyze the impact of changes on Regions Financial’s fair value.
- Versatile Excel Template: Tailored for quick edits, scenario testing, and detailed projections.
- Time-Saving and Accurate: Skip building models from scratch while maintaining precision and flexibility.
Key Features
- Comprehensive DCF Calculator: Features in-depth unlevered and levered DCF valuation models tailored for Regions Financial Corporation (RF).
- WACC Calculator: Ready-to-use Weighted Average Cost of Capital sheet with adjustable inputs for accurate assessments.
- Customizable Forecast Assumptions: Adjust growth rates, capital expenditures, and discount rates to fit your analysis needs.
- Integrated Financial Ratios: Evaluate profitability, leverage, and efficiency ratios specific to Regions Financial Corporation (RF).
- Interactive Dashboard and Charts: Visual representations that highlight essential valuation metrics for straightforward analysis.
How It Works
- Step 1: Download the Excel file.
- Step 2: Review pre-entered Regions Financial Corporation (RF) data (historical and projected).
- Step 3: Adjust key assumptions (yellow cells) based on your analysis.
- Step 4: View automatic recalculations for Regions Financial Corporation’s (RF) intrinsic value.
- Step 5: Use the outputs for investment decisions or reporting.
Why Choose Regions Financial Corporation (RF)?
- Save Time: Access a comprehensive suite of financial services without the hassle of extensive setup.
- Enhance Financial Decisions: Utilize accurate data and expert insights to make informed investment choices.
- Fully Customizable Solutions: Adapt services to meet your unique financial needs and goals.
- User-Friendly Experience: Intuitive platforms and tools simplify your banking and investment processes.
- Trusted by Professionals: Backed by a strong reputation and years of experience in the financial sector.
Who Should Use This Product?
- Investors: Accurately assess Regions Financial Corporation’s (RF) fair value prior to making investment choices.
- CFOs: Utilize a professional-grade DCF model for financial analysis and reporting related to Regions Financial Corporation (RF).
- Consultants: Easily customize the template for client valuation reports involving Regions Financial Corporation (RF).
- Entrepreneurs: Discover insights into the financial modeling practices of successful companies like Regions Financial Corporation (RF).
- Educators: Implement it as a teaching resource to illustrate valuation techniques using Regions Financial Corporation (RF) as a case study.
What the Template Contains
- Pre-Filled Data: Contains Regions Financial Corporation's historical financials and forecasts.
- Discounted Cash Flow Model: Editable DCF valuation model featuring automatic calculations.
- Weighted Average Cost of Capital (WACC): A dedicated sheet for calculating WACC using custom inputs.
- Key Financial Ratios: Evaluate Regions Financial Corporation's profitability, efficiency, and leverage.
- Customizable Inputs: Easily adjust revenue growth, margins, and tax rates.
- Clear Dashboard: Visuals and tables summarizing essential valuation results.
Disclaimer
All information, articles, and product details provided on this website are for general informational and educational purposes only. We do not claim any ownership over, nor do we intend to infringe upon, any trademarks, copyrights, logos, brand names, or other intellectual property mentioned or depicted on this site. Such intellectual property remains the property of its respective owners, and any references here are made solely for identification or informational purposes, without implying any affiliation, endorsement, or partnership.
We make no representations or warranties, express or implied, regarding the accuracy, completeness, or suitability of any content or products presented. Nothing on this website should be construed as legal, tax, investment, financial, medical, or other professional advice. In addition, no part of this site—including articles or product references—constitutes a solicitation, recommendation, endorsement, advertisement, or offer to buy or sell any securities, franchises, or other financial instruments, particularly in jurisdictions where such activity would be unlawful.
All content is of a general nature and may not address the specific circumstances of any individual or entity. It is not a substitute for professional advice or services. Any actions you take based on the information provided here are strictly at your own risk. You accept full responsibility for any decisions or outcomes arising from your use of this website and agree to release us from any liability in connection with your use of, or reliance upon, the content or products found herein.