
|
Rhi Magnesita N.V. (RHIM.L) Avaliação DCF |
Totalmente Editável: Adapte-Se Às Suas Necessidades No Excel Ou Planilhas
Design Profissional: Modelos Confiáveis E Padrão Da Indústria
Pré-Construídos Para Uso Rápido E Eficiente
Compatível com MAC/PC, totalmente desbloqueado
Não É Necessária Experiência; Fácil De Seguir
RHI Magnesita N.V. (RHIM.L) Bundle
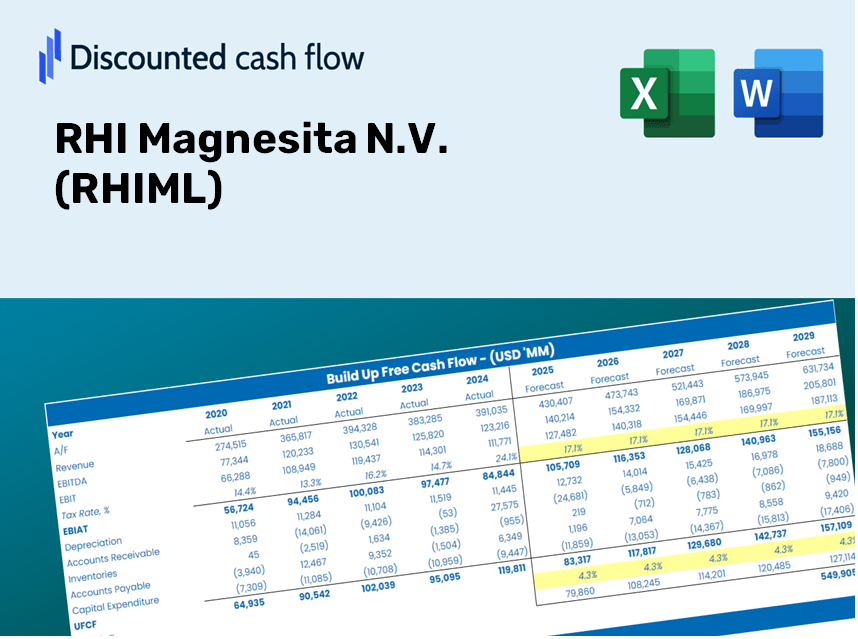
Projetado para precisão, nossa calculadora DCF (RHIML) permite avaliar a avaliação RHI Magnesita N.V. usando dados financeiros atualizados e a flexibilidade para modificar todos os parâmetros-chave para obter previsões aprimoradas.
What You Will Receive
- Pre-Configured Financial Model: RHI Magnesita N.V.'s actual data allows for accurate DCF valuation.
- Comprehensive Forecast Control: Modify revenue growth, profit margins, WACC, and other essential drivers.
- Real-Time Calculations: Automatic updates provide immediate feedback as adjustments are made.
- Professional-Grade Template: A polished Excel document crafted for high-level valuation analysis.
- Flexible and Reusable: Designed for adaptability, enabling repeated application for detailed financial forecasts.
Key Features
- Pre-Loaded Data: RHI Magnesita N.V.'s (RHIML) historical financial statements and pre-filled forecasts.
- Fully Adjustable Inputs: Customize WACC, tax rates, revenue growth, and EBITDA margins.
- Instant Results: View RHI Magnesita N.V.'s (RHIML) intrinsic value recalculated in real time.
- Clear Visual Outputs: Dashboard charts present valuation results and key metrics effectively.
- Built for Accuracy: A professional-grade tool designed for analysts, investors, and finance professionals.
How It Works
- 1. Access the Template: Download and open the Excel file containing RHI Magnesita N.V.'s (RHIML) preloaded data.
- 2. Adjust Key Assumptions: Modify essential inputs such as growth projections, WACC, and capital expenditures.
- 3. Instant Result Calculation: The DCF model automatically computes intrinsic value and NPV based on your inputs.
- 4. Explore Different Scenarios: Analyze various forecasts to evaluate different valuation results.
- 5. Present Findings Confidently: Share professional valuation insights to inform your decision-making process.
Why Opt for This Calculator for RHI Magnesita N.V. (RHIML)?
- Precision: Leveraging real RHI Magnesita financial data to guarantee accuracy.
- Versatility: Crafted for users to easily experiment with and adjust inputs.
- Efficiency: Eliminate the complexity of constructing a DCF model from the ground up.
- Expert-Level: Engineered with the meticulousness and practicality suited for CFOs.
- Intuitive: Simple to navigate, even for individuals with limited financial modeling knowledge.
Who Can Benefit from This Product?
- Investors: Evaluate RHI Magnesita N.V. (RHIML) to make informed stock purchase or sale decisions.
- CFOs and Financial Analysts: Enhance the efficiency of valuation processes and assess forecasts.
- Startup Founders: Understand how leading companies like RHI Magnesita N.V. (RHIML) are appraised.
- Consultants: Produce comprehensive valuation reports for clients in need.
- Students and Educators: Utilize real-world data to learn and teach valuation methodologies.
Components of the Template
- Historical Data: Contains RHI Magnesita N.V.’s past financial performance and foundational forecasts.
- DCF and Levered DCF Models: Comprehensive templates to assess the intrinsic value of RHI Magnesita N.V. (RHIML).
- WACC Sheet: Pre-configured calculations for Weighted Average Cost of Capital.
- Editable Inputs: Adjust essential drivers such as growth rates, EBITDA percentages, and CAPEX assumptions.
- Quarterly and Annual Statements: A thorough breakdown of the financials for RHI Magnesita N.V. (RHIML).
- Interactive Dashboard: Dynamically visualize valuation outcomes and forecasts.
Disclaimer
All information, articles, and product details provided on this website are for general informational and educational purposes only. We do not claim any ownership over, nor do we intend to infringe upon, any trademarks, copyrights, logos, brand names, or other intellectual property mentioned or depicted on this site. Such intellectual property remains the property of its respective owners, and any references here are made solely for identification or informational purposes, without implying any affiliation, endorsement, or partnership.
We make no representations or warranties, express or implied, regarding the accuracy, completeness, or suitability of any content or products presented. Nothing on this website should be construed as legal, tax, investment, financial, medical, or other professional advice. In addition, no part of this site—including articles or product references—constitutes a solicitation, recommendation, endorsement, advertisement, or offer to buy or sell any securities, franchises, or other financial instruments, particularly in jurisdictions where such activity would be unlawful.
All content is of a general nature and may not address the specific circumstances of any individual or entity. It is not a substitute for professional advice or services. Any actions you take based on the information provided here are strictly at your own risk. You accept full responsibility for any decisions or outcomes arising from your use of this website and agree to release us from any liability in connection with your use of, or reliance upon, the content or products found herein.