
|
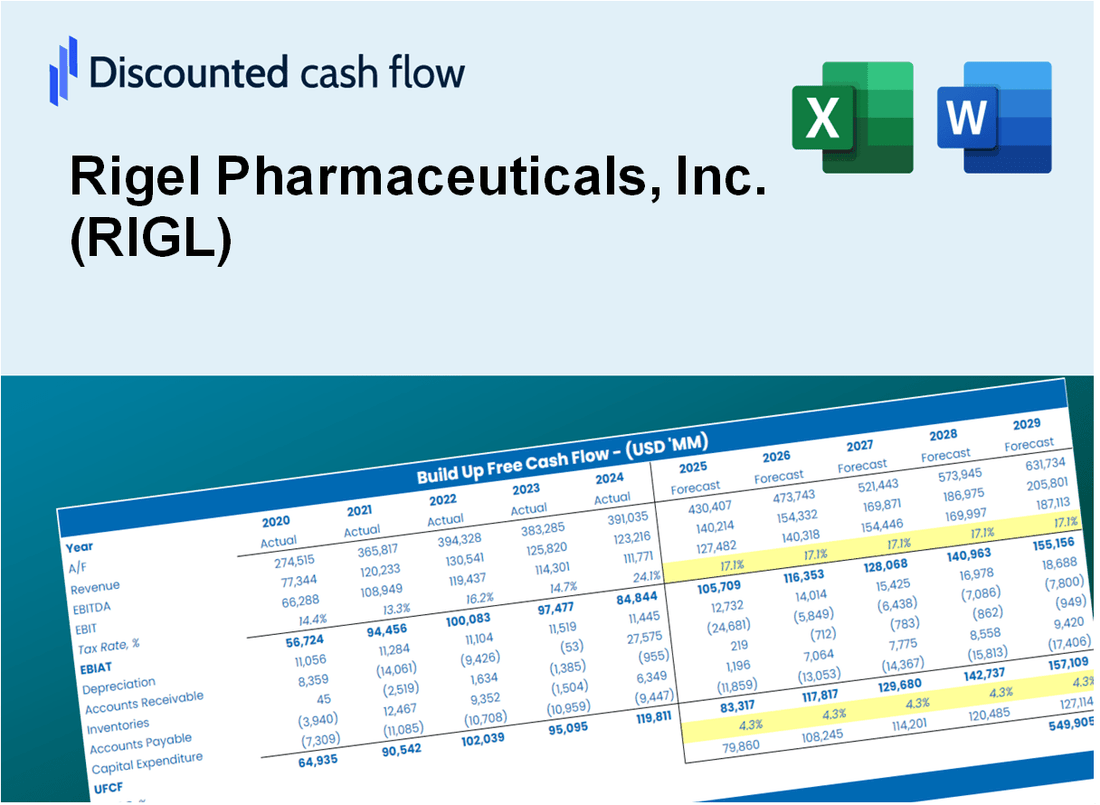
Rigel Pharmaceuticals, Inc. (RIGL) Avaliação DCF |
Totalmente Editável: Adapte-Se Às Suas Necessidades No Excel Ou Planilhas
Design Profissional: Modelos Confiáveis E Padrão Da Indústria
Pré-Construídos Para Uso Rápido E Eficiente
Compatível com MAC/PC, totalmente desbloqueado
Não É Necessária Experiência; Fácil De Seguir
Rigel Pharmaceuticals, Inc. (RIGL) Bundle
Avalie as perspectivas financeiras da Rigel Pharmaceuticals, Inc. (RIGL) como um especialista! Essa calculadora DCF (RIGL) vem com finanças pré-preenchidas e oferece flexibilidade completa para modificar o crescimento da receita, WACC, margens e outras suposições essenciais para se alinhar às suas projeções.
What You Will Get
- Editable Forecast Inputs: Easily modify assumptions (growth %, margins, WACC) to explore various scenarios.
- Real-World Data: Rigel Pharmaceuticals’ financial data pre-filled to kickstart your analysis.
- Automatic DCF Outputs: The template automatically computes Net Present Value (NPV) and intrinsic value for you.
- Customizable and Professional: A sleek Excel model that adjusts to your valuation requirements.
- Built for Analysts and Investors: Perfect for testing projections, validating strategies, and optimizing your time.
Key Features
- Customizable Financial Inputs: Adjust essential metrics such as revenue projections, R&D expenses, and operating costs.
- Instant DCF Valuation: Automatically computes intrinsic value, net present value (NPV), and other financial metrics in real-time.
- High-Precision Results: Leverages Rigel Pharmaceuticals' actual financial data for accurate valuation insights.
- Effortless Scenario Testing: Easily evaluate various scenarios and analyze the resulting impacts side by side.
- Efficiency Booster: Streamlines the valuation process, removing the need for intricate financial model development.
How It Works
- Download the Template: Gain immediate access to the Excel-based RIGL DCF Calculator.
- Input Your Assumptions: Modify the yellow-highlighted cells for growth rates, WACC, margins, and additional parameters.
- Instant Calculations: The model automatically recalculates Rigel Pharmaceuticals' intrinsic value.
- Test Scenarios: Experiment with various assumptions to assess potential changes in valuation.
- Analyze and Decide: Utilize the outcomes to inform your investment or financial analysis.
Why Choose This Calculator for Rigel Pharmaceuticals, Inc. (RIGL)?
- Accuracy: Utilizes authentic Rigel financial data for precise calculations.
- Flexibility: Allows users to easily adjust and experiment with various inputs.
- Time-Saving: Eliminate the need to create a DCF model from the ground up.
- Professional-Grade: Crafted with the expertise and precision expected at the CFO level.
- User-Friendly: Intuitive design ensures accessibility for users without extensive financial modeling skills.
Who Should Use Rigel Pharmaceuticals, Inc. (RIGL)?
- Investors: Gain insights into the biotech sector with our comprehensive analysis tools.
- Healthcare Analysts: Streamline your research with detailed reports on drug development and market potential.
- Consultants: Tailor our resources for client presentations regarding pharmaceutical investments.
- Biotech Enthusiasts: Enhance your knowledge of drug discovery processes and market dynamics.
- Educators and Students: Utilize our materials as a valuable resource in life sciences and finance courses.
What the Template Contains
- Pre-Filled DCF Model: Rigel Pharmaceuticals’ financial data preloaded for immediate use.
- WACC Calculator: Detailed calculations for Weighted Average Cost of Capital.
- Financial Ratios: Evaluate Rigel Pharmaceuticals’ profitability, leverage, and efficiency.
- Editable Inputs: Change assumptions such as growth, margins, and CAPEX to fit your scenarios.
- Financial Statements: Annual and quarterly reports to support detailed analysis.
- Interactive Dashboard: Easily visualize key valuation metrics and results.
Disclaimer
All information, articles, and product details provided on this website are for general informational and educational purposes only. We do not claim any ownership over, nor do we intend to infringe upon, any trademarks, copyrights, logos, brand names, or other intellectual property mentioned or depicted on this site. Such intellectual property remains the property of its respective owners, and any references here are made solely for identification or informational purposes, without implying any affiliation, endorsement, or partnership.
We make no representations or warranties, express or implied, regarding the accuracy, completeness, or suitability of any content or products presented. Nothing on this website should be construed as legal, tax, investment, financial, medical, or other professional advice. In addition, no part of this site—including articles or product references—constitutes a solicitation, recommendation, endorsement, advertisement, or offer to buy or sell any securities, franchises, or other financial instruments, particularly in jurisdictions where such activity would be unlawful.
All content is of a general nature and may not address the specific circumstances of any individual or entity. It is not a substitute for professional advice or services. Any actions you take based on the information provided here are strictly at your own risk. You accept full responsibility for any decisions or outcomes arising from your use of this website and agree to release us from any liability in connection with your use of, or reliance upon, the content or products found herein.