
|
Renew Holdings plc (rnwh.l) Avaliação DCF |
Totalmente Editável: Adapte-Se Às Suas Necessidades No Excel Ou Planilhas
Design Profissional: Modelos Confiáveis E Padrão Da Indústria
Pré-Construídos Para Uso Rápido E Eficiente
Compatível com MAC/PC, totalmente desbloqueado
Não É Necessária Experiência; Fácil De Seguir
Renew Holdings plc (RNWH.L) Bundle
Projetado para precisão, a calculadora DCF RENEW HOLDINGS PLC (RNWHL) permite avaliar a avaliação da empresa usando idéias financeiras do mundo real, fornecendo flexibilidade completa para modificar todos os parâmetros essenciais para obter projeções aprimoradas.
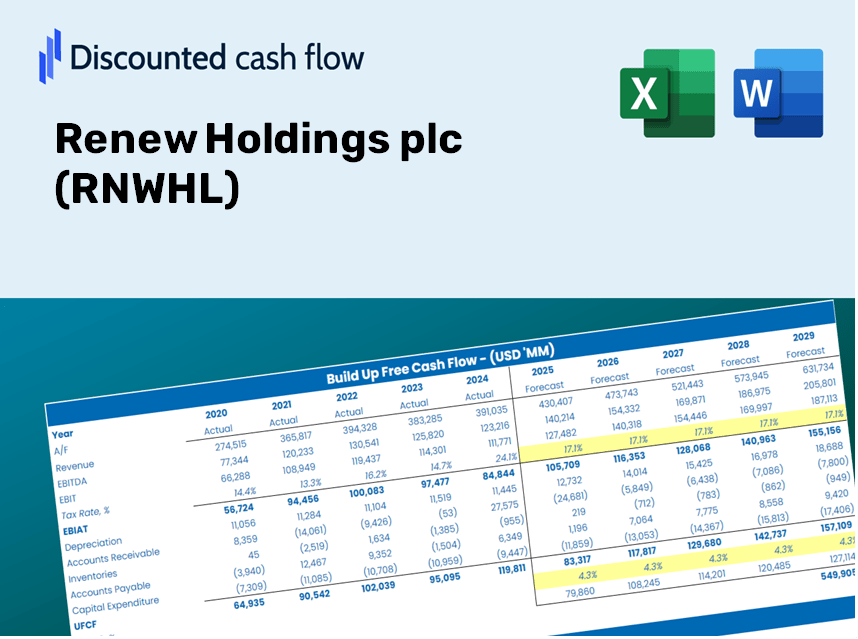
Discounted Cash Flow (DCF) - (USD MM)
| Year | AY1 2020 |
AY2 2021 |
AY3 2022 |
AY4 2023 |
AY5 2024 |
FY1 2025 |
FY2 2026 |
FY3 2027 |
FY4 2028 |
FY5 2029 |
|---|---|---|---|---|---|---|---|---|---|---|
| Revenue | 620.4 | 775.6 | 816.3 | 921.6 | 1,009.0 | 1,141.8 | 1,292.1 | 1,462.1 | 1,654.6 | 1,872.4 |
| Revenue Growth, % | 0 | 25.03 | 5.24 | 12.9 | 9.49 | 13.16 | 13.16 | 13.16 | 13.16 | 13.16 |
| EBITDA | 48.7 | 58.5 | 67.2 | 75.2 | 80.1 | 90.7 | 102.6 | 116.2 | 131.4 | 148.7 |
| EBITDA, % | 7.85 | 7.55 | 8.23 | 8.16 | 7.94 | 7.94 | 7.94 | 7.94 | 7.94 | 7.94 |
| Depreciation | 15.2 | 17.0 | 17.3 | 16.9 | 12.7 | 22.5 | 25.4 | 28.8 | 32.6 | 36.9 |
| Depreciation, % | 2.45 | 2.19 | 2.11 | 1.84 | 1.26 | 1.97 | 1.97 | 1.97 | 1.97 | 1.97 |
| EBIT | 33.5 | 41.6 | 49.9 | 58.2 | 67.4 | 68.2 | 77.2 | 87.4 | 98.9 | 111.9 |
| EBIT, % | 5.4 | 5.36 | 6.12 | 6.32 | 6.68 | 5.97 | 5.97 | 5.97 | 5.97 | 5.97 |
| Total Cash | 13.4 | .9 | 27.6 | 35.7 | 80.2 | 39.9 | 45.1 | 51.1 | 57.8 | 65.4 |
| Total Cash, percent | .0 | .0 | .0 | .0 | .0 | .0 | .0 | .0 | .0 | .0 |
| Account Receivables | 132.0 | 158.8 | 156.9 | 178.6 | 179.6 | 224.1 | 253.6 | 287.0 | 324.8 | 367.5 |
| Account Receivables, % | 21.28 | 20.47 | 19.22 | 19.38 | 17.8 | 19.63 | 19.63 | 19.63 | 19.63 | 19.63 |
| Inventories | 1.6 | 2.1 | 2.6 | 4.2 | 6.4 | 4.4 | 5.0 | 5.7 | 6.4 | 7.2 |
| Inventories, % | 0.26097 | 0.26791 | 0.32011 | 0.45239 | 0.63084 | 0.38644 | 0.38644 | 0.38644 | 0.38644 | 0.38644 |
| Accounts Payable | 44.2 | 49.4 | 62.0 | 73.9 | 56.3 | 79.2 | 89.6 | 101.4 | 114.8 | 129.9 |
| Accounts Payable, % | 7.12 | 6.37 | 7.6 | 8.02 | 5.58 | 6.94 | 6.94 | 6.94 | 6.94 | 6.94 |
| Capital Expenditure | -3.8 | -4.0 | -5.1 | -5.5 | -6.1 | -6.7 | -7.6 | -8.6 | -9.8 | -11.1 |
| Capital Expenditure, % | -0.60544 | -0.52112 | -0.6194 | -0.59779 | -0.60914 | -0.59058 | -0.59058 | -0.59058 | -0.59058 | -0.59058 |
| Tax Rate, % | 30.97 | 30.97 | 30.97 | 30.97 | 30.97 | 30.97 | 30.97 | 30.97 | 30.97 | 30.97 |
| EBITAT | 21.6 | 31.1 | 38.1 | 43.5 | 46.5 | 49.0 | 55.5 | 62.8 | 71.0 | 80.4 |
| Depreciation | ||||||||||
| Changes in Account Receivables | ||||||||||
| Changes in Inventories | ||||||||||
| Changes in Accounts Payable | ||||||||||
| Capital Expenditure | ||||||||||
| UFCF | -56.4 | 22.0 | 64.3 | 43.5 | 32.3 | 45.1 | 53.6 | 60.7 | 68.7 | 77.7 |
| WACC, % | 7.56 | 7.66 | 7.67 | 7.65 | 7.6 | 7.63 | 7.63 | 7.63 | 7.63 | 7.63 |
| PV UFCF | ||||||||||
| SUM PV UFCF | 241.9 | |||||||||
| Long Term Growth Rate, % | 2.00 | |||||||||
| Free cash flow (T + 1) | 79 | |||||||||
| Terminal Value | 1,408 | |||||||||
| Present Terminal Value | 975 | |||||||||
| Enterprise Value | 1,217 | |||||||||
| Net Debt | -4 | |||||||||
| Equity Value | 1,221 | |||||||||
| Diluted Shares Outstanding, MM | 79 | |||||||||
| Equity Value Per Share | 1,541.88 |
What You'll Receive
- Authentic RNWHL Financial Data: Pre-loaded with Renew Holdings' historical and forecasted data for in-depth analysis.
- Completely Customizable Template: Effortlessly adjust vital inputs such as revenue growth, WACC, and EBITDA percentage.
- Instant Calculations: Watch as the intrinsic value of Renew Holdings updates immediately with your modifications.
- Advanced Valuation Tool: Crafted for investors, analysts, and consultants aiming for precise DCF results.
- Intuitive Design: Simplified layout and straightforward instructions suitable for all levels of expertise.
Key Features
- Comprehensive Historical Data: Access Renew Holdings plc's (RNWHL) financial statements and pre-filled projections.
- Customizable Input Fields: Adjust WACC, tax rates, revenue growth, and EBITDA margins as needed.
- Real-Time Valuation: Instantly view the recalculated intrinsic value of Renew Holdings plc (RNWHL).
- Intuitive Visual Analytics: Dashboard charts provide clear insights into valuation outcomes and essential metrics.
- Designed for Precision: A reliable tool tailored for analysts, investors, and financial professionals.
How It Operates
- 1. Access the Template: Download and open the Excel file containing Renew Holdings plc’s (RNWHL) preloaded data.
- 2. Adjust Assumptions: Modify essential inputs such as growth rates, WACC, and capital expenditures.
- 3. See Results in Real-Time: The DCF model automatically calculates intrinsic value and NPV.
- 4. Explore Scenarios: Evaluate various forecasts to assess different valuation possibilities.
- 5. Make Informed Decisions: Present expert valuation insights to back up your strategic choices.
Why Choose This Calculator for Renew Holdings plc (RNWHL)?
- Reliable Data: Utilize accurate financial metrics from Renew Holdings for trustworthy valuation outcomes.
- Flexible Options: Modify essential variables such as growth rates, WACC, and tax rates to align with your forecasts.
- Efficient: Pre-configured calculations save you the hassle of building models from the ground up.
- Professional Tool: Created for investors, analysts, and consultants in mind.
- Easy to Use: User-friendly design and guided instructions ensure accessibility for all users.
Who Can Benefit from This Product?
- Investors: Make informed decisions with a top-tier valuation tool tailored for your needs at Renew Holdings plc (RNWHL).
- Financial Analysts: Streamline your workflow with a customizable DCF model designed for efficiency.
- Consultants: Easily modify the template for client-focused presentations or in-depth reports.
- Finance Enthusiasts: Enhance your knowledge of valuation methods through practical, real-life examples.
- Educators and Students: Utilize this resource as a valuable learning aid in finance-oriented courses.
Contents of the Template
- Comprehensive DCF Model: An editable template featuring detailed valuation calculations.
- Real-World Data: Renew Holdings plc’s (RNWHL) historical and projected financials preloaded for in-depth analysis.
- Customizable Parameters: Modify WACC, growth rates, and tax assumptions to explore various scenarios.
- Financial Statements: Complete annual and quarterly breakdowns for enhanced insights.
- Key Ratios: Integrated analysis for profitability, efficiency, and leverage metrics.
- Dashboard with Visual Outputs: Charts and tables presenting clear, actionable results.
Disclaimer
All information, articles, and product details provided on this website are for general informational and educational purposes only. We do not claim any ownership over, nor do we intend to infringe upon, any trademarks, copyrights, logos, brand names, or other intellectual property mentioned or depicted on this site. Such intellectual property remains the property of its respective owners, and any references here are made solely for identification or informational purposes, without implying any affiliation, endorsement, or partnership.
We make no representations or warranties, express or implied, regarding the accuracy, completeness, or suitability of any content or products presented. Nothing on this website should be construed as legal, tax, investment, financial, medical, or other professional advice. In addition, no part of this site—including articles or product references—constitutes a solicitation, recommendation, endorsement, advertisement, or offer to buy or sell any securities, franchises, or other financial instruments, particularly in jurisdictions where such activity would be unlawful.
All content is of a general nature and may not address the specific circumstances of any individual or entity. It is not a substitute for professional advice or services. Any actions you take based on the information provided here are strictly at your own risk. You accept full responsibility for any decisions or outcomes arising from your use of this website and agree to release us from any liability in connection with your use of, or reliance upon, the content or products found herein.