
|
Rapid7, Inc. (RPD) Avaliação DCF |
Totalmente Editável: Adapte-Se Às Suas Necessidades No Excel Ou Planilhas
Design Profissional: Modelos Confiáveis E Padrão Da Indústria
Pré-Construídos Para Uso Rápido E Eficiente
Compatível com MAC/PC, totalmente desbloqueado
Não É Necessária Experiência; Fácil De Seguir
Rapid7, Inc. (RPD) Bundle
Projetado para precisão, a calculadora RAPID7, Inc. (RPD) DCF permite avaliar a avaliação da Rapid7, Inc. com dados financeiros do mundo real, oferecendo flexibilidade completa para modificar todos os parâmetros essenciais para melhorar as projeções.
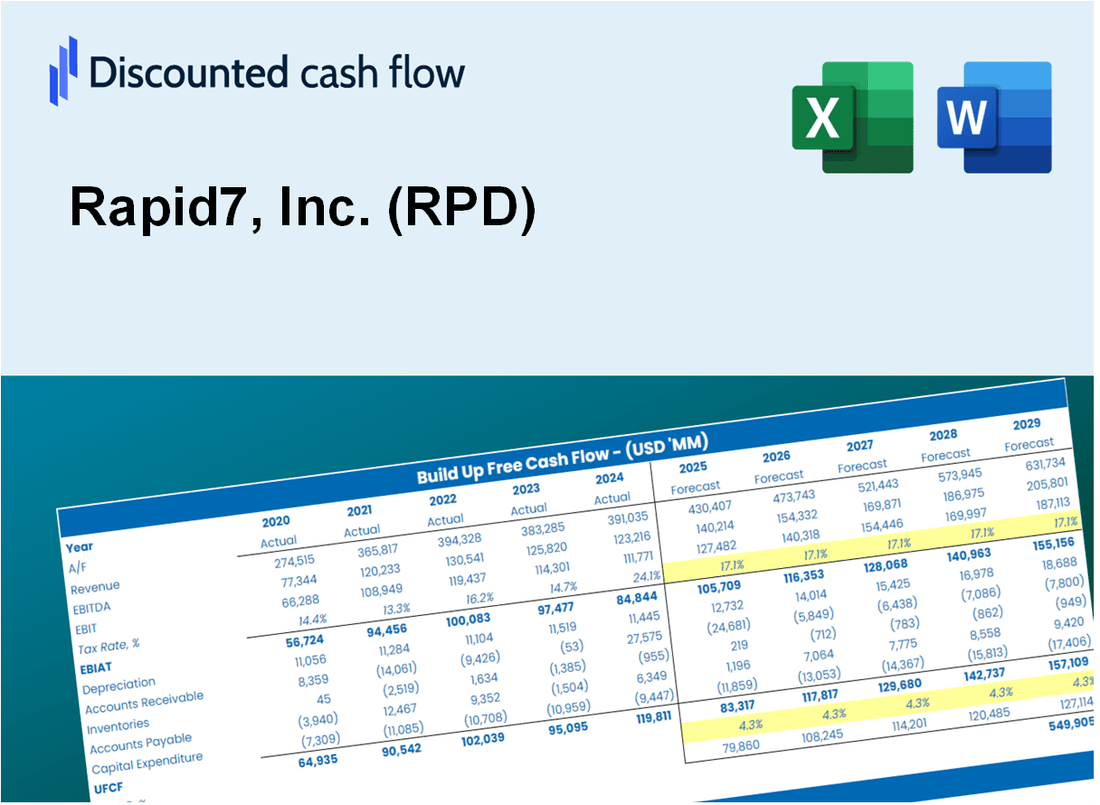
Discounted Cash Flow (DCF) - (USD MM)
| Year | AY1 2020 |
AY2 2021 |
AY3 2022 |
AY4 2023 |
AY5 2024 |
FY1 2025 |
FY2 2026 |
FY3 2027 |
FY4 2028 |
FY5 2029 |
|---|---|---|---|---|---|---|---|---|---|---|
| Revenue | 411.5 | 535.4 | 685.1 | 777.7 | 844.0 | 1,013.1 | 1,216.0 | 1,459.5 | 1,751.8 | 2,102.7 |
| Revenue Growth, % | 0 | 30.11 | 27.96 | 13.52 | 8.53 | 20.03 | 20.03 | 20.03 | 20.03 | 20.03 |
| EBITDA | -50.1 | -88.1 | -70.3 | -39.1 | 97.3 | -65.6 | -78.8 | -94.6 | -113.5 | -136.2 |
| EBITDA, % | -12.17 | -16.46 | -10.26 | -5.03 | 11.53 | -6.48 | -6.48 | -6.48 | -6.48 | -6.48 |
| Depreciation | 22.6 | 33.5 | 41.0 | 45.9 | 44.9 | 58.7 | 70.5 | 84.6 | 101.5 | 121.8 |
| Depreciation, % | 5.5 | 6.26 | 5.99 | 5.91 | 5.32 | 5.79 | 5.79 | 5.79 | 5.79 | 5.79 |
| EBIT | -72.7 | -121.6 | -111.3 | -85.1 | 52.4 | -124.3 | -149.2 | -179.1 | -215.0 | -258.1 |
| EBIT, % | -17.67 | -22.72 | -16.25 | -10.94 | 6.21 | -12.27 | -12.27 | -12.27 | -12.27 | -12.27 |
| Total Cash | 312.5 | 223.4 | 291.4 | 383.2 | 521.7 | 549.7 | 659.8 | 791.9 | 950.5 | 1,140.9 |
| Total Cash, percent | .0 | .0 | .0 | .0 | .0 | .0 | .0 | .0 | .0 | .0 |
| Account Receivables | 111.6 | 146.1 | 152.0 | 164.9 | 168.2 | 238.5 | 286.3 | 343.7 | 412.5 | 495.1 |
| Account Receivables, % | 27.12 | 27.29 | 22.19 | 21.2 | 19.93 | 23.55 | 23.55 | 23.55 | 23.55 | 23.55 |
| Inventories | .0 | .0 | .0 | .0 | .0 | .0 | .0 | .0 | .0 | .0 |
| Inventories, % | 0 | 0 | 0 | 0 | 0 | 0 | 0 | 0 | 0 | 0 |
| Accounts Payable | 3.9 | 3.5 | 10.3 | 15.8 | 18.9 | 14.9 | 17.9 | 21.5 | 25.8 | 31.0 |
| Accounts Payable, % | 0.93806 | 0.65763 | 1.5 | 2.03 | 2.24 | 1.47 | 1.47 | 1.47 | 1.47 | 1.47 |
| Capital Expenditure | -13.8 | -9.0 | -20.4 | -4.4 | -3.4 | -18.2 | -21.8 | -26.2 | -31.5 | -37.8 |
| Capital Expenditure, % | -3.35 | -1.68 | -2.98 | -0.56139 | -0.4058 | -1.8 | -1.8 | -1.8 | -1.8 | -1.8 |
| Tax Rate, % | 38.42 | 38.42 | 38.42 | 38.42 | 38.42 | 38.42 | 38.42 | 38.42 | 38.42 | 38.42 |
| EBITAT | -74.2 | -130.9 | -113.5 | -84.8 | 32.3 | -114.7 | -137.7 | -165.2 | -198.3 | -238.1 |
| Depreciation | ||||||||||
| Changes in Account Receivables | ||||||||||
| Changes in Inventories | ||||||||||
| Changes in Accounts Payable | ||||||||||
| Capital Expenditure | ||||||||||
| UFCF | -173.1 | -141.3 | -92.1 | -50.5 | 73.5 | -148.5 | -133.8 | -160.6 | -192.8 | -231.4 |
| WACC, % | 5.57 | 5.57 | 5.57 | 5.56 | 4.8 | 5.41 | 5.41 | 5.41 | 5.41 | 5.41 |
| PV UFCF | ||||||||||
| SUM PV UFCF | -732.4 | |||||||||
| Long Term Growth Rate, % | 2.00 | |||||||||
| Free cash flow (T + 1) | -236 | |||||||||
| Terminal Value | -6,917 | |||||||||
| Present Terminal Value | -5,315 | |||||||||
| Enterprise Value | -6,047 | |||||||||
| Net Debt | 683 | |||||||||
| Equity Value | -6,730 | |||||||||
| Diluted Shares Outstanding, MM | 63 | |||||||||
| Equity Value Per Share | -106.52 |
What You Will Receive
- Authentic RPD Financial Data: Pre-loaded with Rapid7’s historical and forecasted data for accurate analysis.
- Completely Customizable Template: Easily adjust key inputs such as revenue growth, WACC, and EBITDA %.
- Instant Calculations: Observe Rapid7’s intrinsic value update in real-time as you make adjustments.
- Expert Valuation Tool: Tailored for investors, analysts, and consultants aiming for precise DCF outcomes.
- Intuitive Design: Streamlined layout and straightforward instructions suitable for all skill levels.
Key Features
- Comprehensive Data: Rapid7’s historical performance metrics and pre-populated projections.
- Customizable Parameters: Adjust WACC, tax rates, revenue growth, and EBITDA margins as needed.
- Real-Time Analysis: Monitor Rapid7’s intrinsic value updates instantly.
- Intuitive Visualizations: Interactive dashboard charts present valuation outcomes and essential metrics.
- Designed for Precision: A robust tool tailored for analysts, investors, and financial professionals.
How It Works
- Step 1: Download the prebuilt Excel template featuring Rapid7, Inc.'s (RPD) data.
- Step 2: Review the pre-filled sheets to familiarize yourself with the essential metrics.
- Step 3: Modify forecasts and assumptions in the editable yellow cells (WACC, growth, margins).
- Step 4: Instantly observe the recalculated results, including Rapid7, Inc.'s (RPD) intrinsic value.
- Step 5: Make well-informed investment decisions or create reports based on the outputs.
Why Choose This Calculator?
- User-Friendly Interface: Perfect for both newcomers and seasoned professionals.
- Customizable Inputs: Modify parameters easily to suit your specific analysis needs.
- Real-Time Feedback: Observe immediate adjustments in Rapid7, Inc. (RPD)'s valuation as you change inputs.
- Preloaded Data: Comes with Rapid7, Inc. (RPD)'s latest financial information for swift evaluations.
- Preferred by Experts: Utilized by investors and analysts for making well-informed choices.
Who Should Use Rapid7, Inc. (RPD)?
- Cybersecurity Students: Understand threat detection and response strategies using real-world scenarios.
- Researchers: Integrate cutting-edge security models into academic studies or projects.
- IT Professionals: Validate your security frameworks and analyze incident response effectiveness for Rapid7 solutions.
- Security Analysts: Enhance your efficiency with a customizable threat intelligence platform.
- Business Leaders: Learn how enterprise security is assessed and managed in large organizations like Rapid7.
What the Template Contains
- Comprehensive DCF Model: Editable template with detailed valuation calculations tailored for Rapid7, Inc. (RPD).
- Real-World Data: Rapid7’s historical and projected financials preloaded for analysis.
- Customizable Parameters: Adjust WACC, growth rates, and tax assumptions to test various scenarios.
- Financial Statements: Complete annual and quarterly breakdowns for deeper insights into Rapid7's performance.
- Key Ratios: Built-in analysis for profitability, efficiency, and leverage specific to Rapid7, Inc. (RPD).
- Dashboard with Visual Outputs: Charts and tables providing clear, actionable results for informed decision-making.
Disclaimer
All information, articles, and product details provided on this website are for general informational and educational purposes only. We do not claim any ownership over, nor do we intend to infringe upon, any trademarks, copyrights, logos, brand names, or other intellectual property mentioned or depicted on this site. Such intellectual property remains the property of its respective owners, and any references here are made solely for identification or informational purposes, without implying any affiliation, endorsement, or partnership.
We make no representations or warranties, express or implied, regarding the accuracy, completeness, or suitability of any content or products presented. Nothing on this website should be construed as legal, tax, investment, financial, medical, or other professional advice. In addition, no part of this site—including articles or product references—constitutes a solicitation, recommendation, endorsement, advertisement, or offer to buy or sell any securities, franchises, or other financial instruments, particularly in jurisdictions where such activity would be unlawful.
All content is of a general nature and may not address the specific circumstances of any individual or entity. It is not a substitute for professional advice or services. Any actions you take based on the information provided here are strictly at your own risk. You accept full responsibility for any decisions or outcomes arising from your use of this website and agree to release us from any liability in connection with your use of, or reliance upon, the content or products found herein.