
|
Red Rock Resorts, Inc. (RRR) Avaliação DCF |
Totalmente Editável: Adapte-Se Às Suas Necessidades No Excel Ou Planilhas
Design Profissional: Modelos Confiáveis E Padrão Da Indústria
Pré-Construídos Para Uso Rápido E Eficiente
Compatível com MAC/PC, totalmente desbloqueado
Não É Necessária Experiência; Fácil De Seguir
Red Rock Resorts, Inc. (RRR) Bundle
Aprimore suas estratégias de investimento com a calculadora DCF Red Rock Resorts, Inc. (RRR)! Explore dados financeiros autênticos, ajuste as previsões e despesas do crescimento e observe instantaneamente como essas modificações afetam o valor intrínseco do Red Rock Resorts, Inc. (RRR).
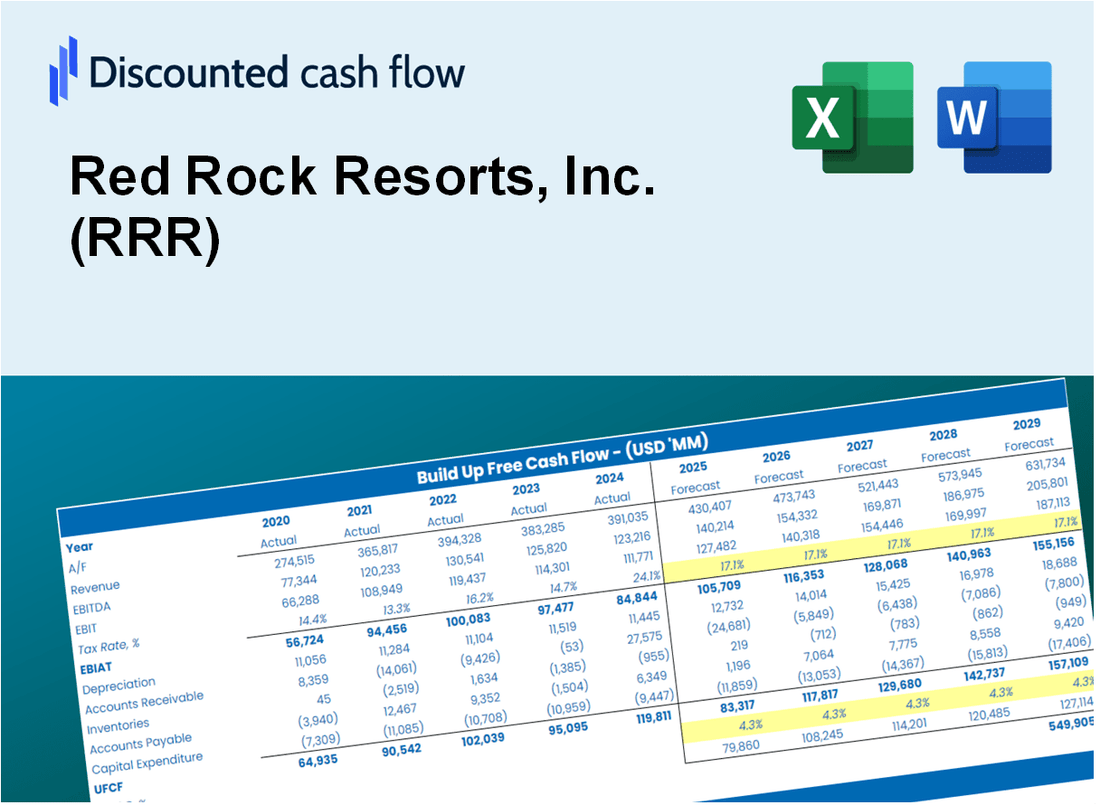
Discounted Cash Flow (DCF) - (USD MM)
| Year | AY1 2020 |
AY2 2021 |
AY3 2022 |
AY4 2023 |
AY5 2024 |
FY1 2025 |
FY2 2026 |
FY3 2027 |
FY4 2028 |
FY5 2029 |
|---|---|---|---|---|---|---|---|---|---|---|
| Revenue | 1,182.4 | 1,617.9 | 1,663.8 | 1,724.1 | 1,939.0 | 2,209.3 | 2,517.2 | 2,868.1 | 3,267.8 | 3,723.3 |
| Revenue Growth, % | 0 | 36.83 | 2.84 | 3.62 | 12.47 | 13.94 | 13.94 | 13.94 | 13.94 | 13.94 |
| EBITDA | 300.8 | 546.5 | 693.1 | 694.3 | 744.1 | 793.3 | 903.8 | 1,029.8 | 1,173.3 | 1,336.9 |
| EBITDA, % | 25.44 | 33.78 | 41.66 | 40.27 | 38.38 | 35.91 | 35.91 | 35.91 | 35.91 | 35.91 |
| Depreciation | 231.4 | 157.8 | 128.4 | 132.5 | 187.1 | 240.3 | 273.7 | 311.9 | 355.4 | 404.9 |
| Depreciation, % | 19.57 | 9.75 | 7.72 | 7.69 | 9.65 | 10.87 | 10.87 | 10.87 | 10.87 | 10.87 |
| EBIT | 69.4 | 388.7 | 564.8 | 561.8 | 557.0 | 553.0 | 630.1 | 717.9 | 818.0 | 932.0 |
| EBIT, % | 5.87 | 24.03 | 33.94 | 32.58 | 28.73 | 25.03 | 25.03 | 25.03 | 25.03 | 25.03 |
| Total Cash | 121.2 | 275.3 | 117.3 | 137.6 | 164.4 | 224.3 | 255.6 | 291.2 | 331.8 | 378.1 |
| Total Cash, percent | .0 | .0 | .0 | .0 | .0 | .0 | .0 | .0 | .0 | .0 |
| Account Receivables | 35.1 | 36.7 | 43.6 | 76.4 | 64.4 | 69.0 | 78.6 | 89.6 | 102.0 | 116.3 |
| Account Receivables, % | 2.97 | 2.27 | 2.62 | 4.43 | 3.32 | 3.12 | 3.12 | 3.12 | 3.12 | 3.12 |
| Inventories | 13.1 | 11.7 | 13.2 | 15.3 | 16.4 | 19.2 | 21.9 | 25.0 | 28.5 | 32.4 |
| Inventories, % | 1.11 | 0.72526 | 0.79331 | 0.88482 | 0.84626 | 0.87115 | 0.87115 | 0.87115 | 0.87115 | 0.87115 |
| Accounts Payable | 11.2 | 17.5 | 11.4 | 25.4 | 31.8 | 25.7 | 29.3 | 33.4 | 38.1 | 43.4 |
| Accounts Payable, % | 0.94787 | 1.08 | 0.68404 | 1.47 | 1.64 | 1.16 | 1.16 | 1.16 | 1.16 | 1.16 |
| Capital Expenditure | -58.5 | -65.9 | -561.3 | -701.6 | -298.8 | -436.9 | -497.8 | -567.1 | -646.2 | -736.2 |
| Capital Expenditure, % | -4.95 | -4.08 | -33.74 | -40.7 | -15.41 | -19.77 | -19.77 | -19.77 | -19.77 | -19.77 |
| Tax Rate, % | 53.06 | 53.06 | 53.06 | 53.06 | 53.06 | 53.06 | 53.06 | 53.06 | 53.06 | 53.06 |
| EBITAT | 172.6 | 329.3 | 266.8 | 259.7 | 261.4 | 359.6 | 409.7 | 466.8 | 531.8 | 606.0 |
| Depreciation | ||||||||||
| Changes in Account Receivables | ||||||||||
| Changes in Inventories | ||||||||||
| Changes in Accounts Payable | ||||||||||
| Capital Expenditure | ||||||||||
| UFCF | 308.5 | 427.1 | -180.6 | -330.2 | 167.0 | 149.4 | 177.0 | 201.6 | 229.7 | 261.7 |
| WACC, % | 9.15 | 8.78 | 7.88 | 7.85 | 7.87 | 8.31 | 8.31 | 8.31 | 8.31 | 8.31 |
| PV UFCF | ||||||||||
| SUM PV UFCF | 790.1 | |||||||||
| Long Term Growth Rate, % | 2.00 | |||||||||
| Free cash flow (T + 1) | 267 | |||||||||
| Terminal Value | 4,233 | |||||||||
| Present Terminal Value | 2,840 | |||||||||
| Enterprise Value | 3,630 | |||||||||
| Net Debt | 3,250 | |||||||||
| Equity Value | 381 | |||||||||
| Diluted Shares Outstanding, MM | 104 | |||||||||
| Equity Value Per Share | 3.67 |
What You Will Get
- Pre-Filled Financial Model: Red Rock Resorts, Inc. (RRR) data facilitates accurate DCF valuation.
- Full Forecast Control: Modify revenue growth, profit margins, WACC, and other essential variables.
- Instant Calculations: Real-time updates ensure you see outcomes as you make adjustments.
- Investor-Ready Template: A polished Excel file crafted for high-quality valuation presentations.
- Customizable and Reusable: Designed for adaptability, allowing for repeated use in comprehensive forecasts.
Key Features
- Comprehensive Financial Data: Red Rock Resorts, Inc. (RRR) offers extensive historical financial statements and pre-filled projections.
- Customizable Variables: Modify WACC, tax rates, revenue growth, and EBITDA margins to suit your analysis.
- Real-Time Valuation: Instantly view Red Rock Resorts, Inc. (RRR) intrinsic value updates as you adjust inputs.
- Intuitive Visualizations: User-friendly dashboard charts showcase valuation outcomes and essential metrics.
- Designed for Precision: A reliable resource tailored for analysts, investors, and finance professionals.
How It Works
- Step 1: Download the Excel file.
- Step 2: Review pre-entered Red Rock Resorts, Inc. (RRR) data (historical and projected).
- Step 3: Adjust key assumptions (yellow cells) based on your analysis.
- Step 4: View automatic recalculations for Red Rock Resorts, Inc. (RRR)’s intrinsic value.
- Step 5: Use the outputs for investment decisions or reporting.
Why Choose This Calculator for Red Rock Resorts, Inc. (RRR)?
- User-Friendly Interface: Tailored for both novices and seasoned professionals.
- Customizable Inputs: Easily adjust parameters to suit your financial analysis.
- Real-Time Feedback: Observe immediate changes to Red Rock Resorts’ valuation as you modify inputs.
- Instant Access: Comes preloaded with Red Rock Resorts’ latest financial data for swift evaluations.
- Industry Approved: Favored by investors and analysts for making well-informed choices.
Who Should Use This Product?
- Individual Investors: Make informed decisions about buying or selling Red Rock Resorts, Inc. (RRR) stock.
- Financial Analysts: Streamline valuation processes with ready-to-use financial models for Red Rock Resorts, Inc. (RRR).
- Consultants: Deliver professional valuation insights on Red Rock Resorts, Inc. (RRR) to clients quickly and accurately.
- Business Owners: Understand how companies like Red Rock Resorts, Inc. (RRR) are valued to guide your own strategy.
- Finance Students: Learn valuation techniques using real-world data and scenarios related to Red Rock Resorts, Inc. (RRR).
What the Template Contains
- Pre-Filled DCF Model: Red Rock Resorts, Inc. (RRR)’s financial data preloaded for immediate use.
- WACC Calculator: Detailed calculations for Weighted Average Cost of Capital.
- Financial Ratios: Evaluate Red Rock Resorts, Inc. (RRR)’s profitability, leverage, and efficiency.
- Editable Inputs: Change assumptions such as growth, margins, and CAPEX to fit your scenarios.
- Financial Statements: Annual and quarterly reports to support detailed analysis.
- Interactive Dashboard: Easily visualize key valuation metrics and results.
Disclaimer
All information, articles, and product details provided on this website are for general informational and educational purposes only. We do not claim any ownership over, nor do we intend to infringe upon, any trademarks, copyrights, logos, brand names, or other intellectual property mentioned or depicted on this site. Such intellectual property remains the property of its respective owners, and any references here are made solely for identification or informational purposes, without implying any affiliation, endorsement, or partnership.
We make no representations or warranties, express or implied, regarding the accuracy, completeness, or suitability of any content or products presented. Nothing on this website should be construed as legal, tax, investment, financial, medical, or other professional advice. In addition, no part of this site—including articles or product references—constitutes a solicitation, recommendation, endorsement, advertisement, or offer to buy or sell any securities, franchises, or other financial instruments, particularly in jurisdictions where such activity would be unlawful.
All content is of a general nature and may not address the specific circumstances of any individual or entity. It is not a substitute for professional advice or services. Any actions you take based on the information provided here are strictly at your own risk. You accept full responsibility for any decisions or outcomes arising from your use of this website and agree to release us from any liability in connection with your use of, or reliance upon, the content or products found herein.