
|
Renishaw plc (RSW.L) Avaliação DCF |
Totalmente Editável: Adapte-Se Às Suas Necessidades No Excel Ou Planilhas
Design Profissional: Modelos Confiáveis E Padrão Da Indústria
Pré-Construídos Para Uso Rápido E Eficiente
Compatível com MAC/PC, totalmente desbloqueado
Não É Necessária Experiência; Fácil De Seguir
Renishaw plc (RSW.L) Bundle
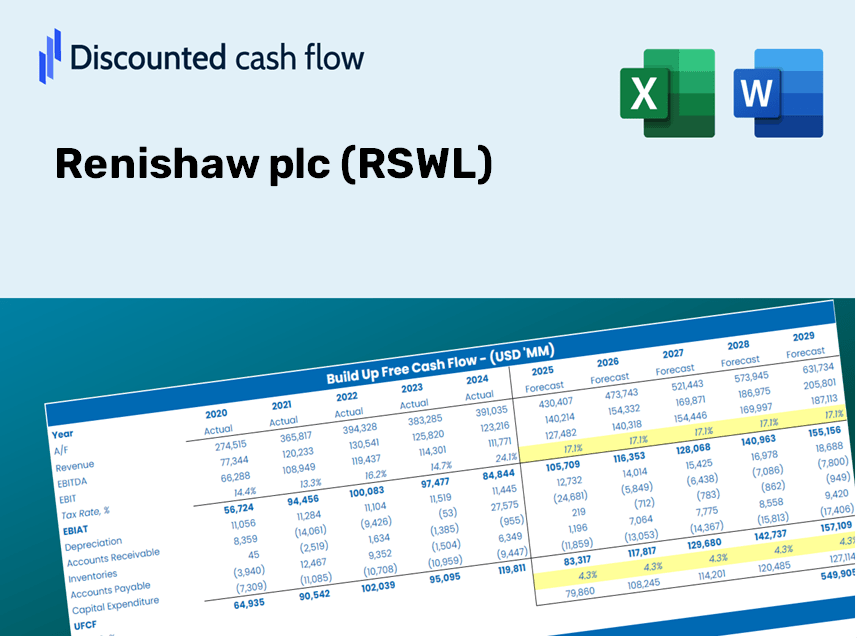
Projetado para precisão, a calculadora DCF Renishaw Plc (RSWL) capacita você a avaliar a avaliação do Renishaw Plc com dados financeiros do mundo real, oferecendo flexibilidade completa para modificar todos os parâmetros essenciais para projeções aprimoradas.
Discounted Cash Flow (DCF) - (USD MM)
| Year | AY1 2021 |
AY2 2022 |
AY3 2023 |
AY4 2024 |
AY5 2025 |
FY1 2026 |
FY2 2027 |
FY3 2028 |
FY4 2029 |
FY5 2030 |
|---|---|---|---|---|---|---|---|---|---|---|
| Revenue | 567.4 | 673.7 | 688.6 | 691.3 | 713.0 | 756.7 | 803.0 | 852.1 | 904.2 | 959.6 |
| Revenue Growth, % | 0 | 18.73 | 2.21 | 0.39618 | 3.15 | 6.12 | 6.12 | 6.12 | 6.12 | 6.12 |
| EBITDA | 172.4 | 174.0 | 166.4 | 156.1 | 133.9 | 184.2 | 195.5 | 207.4 | 220.1 | 233.6 |
| EBITDA, % | 30.37 | 25.83 | 24.16 | 22.58 | 18.78 | 24.34 | 24.34 | 24.34 | 24.34 | 24.34 |
| Depreciation | 39.0 | 36.0 | 30.0 | 32.8 | 23.7 | 37.3 | 39.6 | 42.0 | 44.6 | 47.3 |
| Depreciation, % | 6.87 | 5.35 | 4.36 | 4.75 | 3.32 | 4.93 | 4.93 | 4.93 | 4.93 | 4.93 |
| EBIT | 133.4 | 138.0 | 136.4 | 123.2 | 110.2 | 146.9 | 155.9 | 165.4 | 175.6 | 186.3 |
| EBIT, % | 23.5 | 20.48 | 19.8 | 17.83 | 15.46 | 19.41 | 19.41 | 19.41 | 19.41 | 19.41 |
| Total Cash | 215.0 | 253.2 | 206.4 | 217.8 | 273.6 | 265.3 | 281.6 | 298.8 | 317.1 | 336.5 |
| Total Cash, percent | .0 | .0 | .0 | .0 | .0 | .0 | .0 | .0 | .0 | .0 |
| Account Receivables | 121.1 | 167.7 | 164.2 | 180.4 | 135.2 | 174.3 | 184.9 | 196.2 | 208.2 | 221.0 |
| Account Receivables, % | 21.35 | 24.9 | 23.85 | 26.1 | 18.96 | 23.03 | 23.03 | 23.03 | 23.03 | 23.03 |
| Inventories | 113.6 | 162.5 | 185.8 | 161.9 | 159.5 | 176.9 | 187.7 | 199.2 | 211.4 | 224.3 |
| Inventories, % | 20.01 | 24.12 | 26.98 | 23.42 | 22.36 | 23.38 | 23.38 | 23.38 | 23.38 | 23.38 |
| Accounts Payable | 24.7 | 30.9 | 21.6 | 21.3 | 25.9 | 28.5 | 30.2 | 32.0 | 34.0 | 36.1 |
| Accounts Payable, % | 4.36 | 4.59 | 3.13 | 3.09 | 3.64 | 3.76 | 3.76 | 3.76 | 3.76 | 3.76 |
| Capital Expenditure | -23.7 | -39.7 | -84.6 | -74.8 | -46.3 | -60.0 | -63.7 | -67.6 | -71.7 | -76.1 |
| Capital Expenditure, % | -4.18 | -5.89 | -12.29 | -10.82 | -6.49 | -7.93 | -7.93 | -7.93 | -7.93 | -7.93 |
| Tax Rate, % | 29.02 | 29.02 | 29.02 | 29.02 | 29.02 | 29.02 | 29.02 | 29.02 | 29.02 | 29.02 |
| EBITAT | 106.6 | 114.1 | 109.1 | 97.4 | 78.2 | 115.4 | 122.4 | 129.9 | 137.9 | 146.3 |
| Depreciation | ||||||||||
| Changes in Account Receivables | ||||||||||
| Changes in Inventories | ||||||||||
| Changes in Accounts Payable | ||||||||||
| Capital Expenditure | ||||||||||
| UFCF | -88.1 | 21.1 | 25.4 | 62.8 | 108.0 | 38.6 | 78.6 | 83.4 | 88.5 | 93.9 |
| WACC, % | 7.68 | 7.68 | 7.68 | 7.68 | 7.66 | 7.67 | 7.67 | 7.67 | 7.67 | 7.67 |
| PV UFCF | ||||||||||
| SUM PV UFCF | 301.2 | |||||||||
| Long Term Growth Rate, % | 2.00 | |||||||||
| Free cash flow (T + 1) | 96 | |||||||||
| Terminal Value | 1,688 | |||||||||
| Present Terminal Value | 1,166 | |||||||||
| Enterprise Value | 1,467 | |||||||||
| Net Debt | -72 | |||||||||
| Equity Value | 1,539 | |||||||||
| Diluted Shares Outstanding, MM | 73 | |||||||||
| Equity Value Per Share | 2,116.17 |
What You Will Receive
- Authentic RSWL Financial Data: Access to both historical and projected figures for precise valuation.
- Customizable Parameters: Adjust WACC, tax rates, revenue growth, and capital expenditures to fit your analysis.
- Dynamic Calculations: Intrinsic value and NPV are computed automatically as inputs change.
- Scenario Analysis: Explore various scenarios to assess Renishaw’s potential future performance.
- User-Friendly Design: Crafted for industry professionals, yet simple enough for newcomers.
Key Features
- 🔍 Real-Life RSWL Financials: Pre-filled historical and projected data for Renishaw plc.
- ✏️ Fully Customizable Inputs: Adjust all critical parameters (yellow cells) such as WACC, growth %, and tax rates.
- 📊 Professional DCF Valuation: Integrated formulas compute Renishaw’s intrinsic value using the Discounted Cash Flow method.
- ⚡ Instant Results: View Renishaw’s valuation immediately after making adjustments.
- Scenario Analysis: Evaluate and compare outcomes for different financial assumptions side-by-side.
How It Functions
- 1. Download the Template: Obtain and open the Excel file featuring Renishaw plc’s preloaded data.
- 2. Adjust Assumptions: Modify essential inputs such as growth rates, WACC, and capital expenditures.
- 3. Instant Results: The DCF model automatically calculates intrinsic value and NPV in real-time.
- 4. Explore Scenarios: Evaluate various forecasts to assess different valuation possibilities.
- 5. Present with Assurance: Share expert valuation insights to inform your decision-making process.
Why Opt for This Calculator?
- All-in-One Solution: Combines DCF, WACC, and financial ratios in a single tool.
- Tailorable Inputs: Modify the highlighted cells to explore different scenarios.
- In-Depth Analysis: Automatically computes Renishaw plc’s intrinsic value and Net Present Value.
- Integrated Data: Historical and projected data provide a reliable foundation for analysis.
- High-Quality Standards: Perfect for financial analysts, investors, and business consultants.
Who Can Benefit from Renishaw plc (RSWL)?
- Investors: Gain assurance in your investment choices with our advanced valuation tool.
- Financial Analysts: Streamline your workflow with a ready-to-customize DCF model.
- Consultants: Effortlessly modify the template for impactful client presentations or reports.
- Finance Enthusiasts: Enhance your grasp of valuation methods through practical, real-world applications.
- Educators and Students: Leverage this tool for hands-on learning in finance-related academic programs.
Contents of the Template
- Pre-Filled DCF Model: Renishaw plc’s financial data ready for immediate application.
- WACC Calculator: Comprehensive calculations for Weighted Average Cost of Capital.
- Financial Ratios: Assess Renishaw plc’s profitability, leverage, and efficiency metrics.
- Editable Inputs: Modify assumptions such as growth rates, margins, and CAPEX to suit your analysis.
- Financial Statements: Access annual and quarterly reports for in-depth examination.
- Interactive Dashboard: Effortlessly visualize essential valuation metrics and outcomes.
Disclaimer
All information, articles, and product details provided on this website are for general informational and educational purposes only. We do not claim any ownership over, nor do we intend to infringe upon, any trademarks, copyrights, logos, brand names, or other intellectual property mentioned or depicted on this site. Such intellectual property remains the property of its respective owners, and any references here are made solely for identification or informational purposes, without implying any affiliation, endorsement, or partnership.
We make no representations or warranties, express or implied, regarding the accuracy, completeness, or suitability of any content or products presented. Nothing on this website should be construed as legal, tax, investment, financial, medical, or other professional advice. In addition, no part of this site—including articles or product references—constitutes a solicitation, recommendation, endorsement, advertisement, or offer to buy or sell any securities, franchises, or other financial instruments, particularly in jurisdictions where such activity would be unlawful.
All content is of a general nature and may not address the specific circumstances of any individual or entity. It is not a substitute for professional advice or services. Any actions you take based on the information provided here are strictly at your own risk. You accept full responsibility for any decisions or outcomes arising from your use of this website and agree to release us from any liability in connection with your use of, or reliance upon, the content or products found herein.