
|
Keystone RealTors Limited (Rustomjee.NS) Avaliação DCF |
Totalmente Editável: Adapte-Se Às Suas Necessidades No Excel Ou Planilhas
Design Profissional: Modelos Confiáveis E Padrão Da Indústria
Pré-Construídos Para Uso Rápido E Eficiente
Compatível com MAC/PC, totalmente desbloqueado
Não É Necessária Experiência; Fácil De Seguir
Keystone Realtors Limited (RUSTOMJEE.NS) Bundle
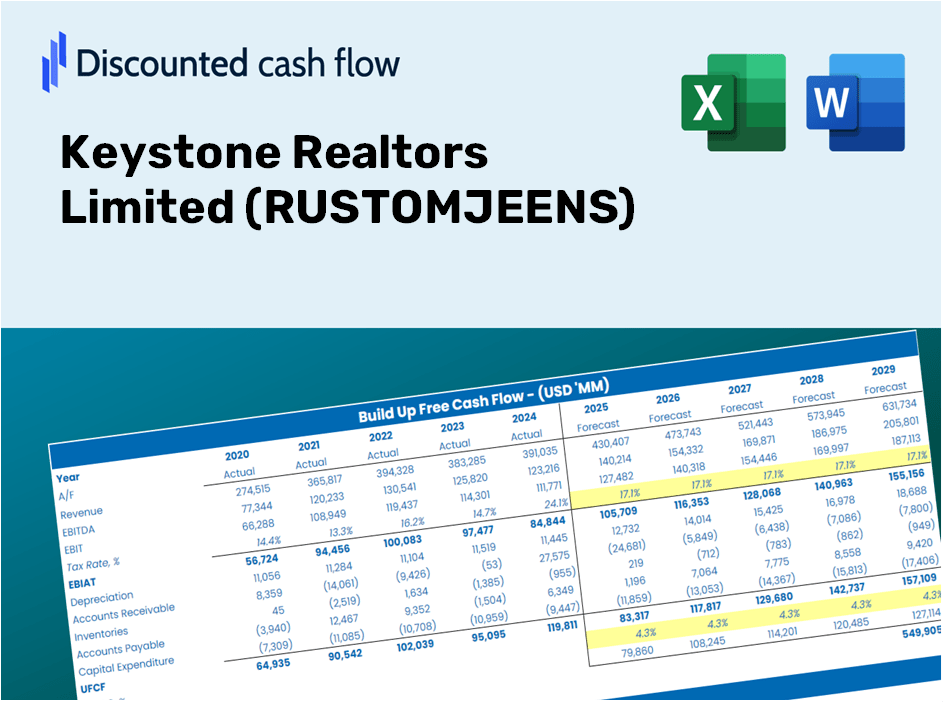
Procurando avaliar o valor intrínseco dos corretores de imóveis Keystone? Nossa calculadora DCF (Rustomjeens) integra dados reais de mercado com recursos abrangentes de personalização, permitindo refinar suas previsões e aprimorar suas estratégias de investimento.
Benefits You Will Receive
- Modifiable Forecast Inputs: Easily adjust key parameters (growth %, profit margins, WACC) to explore various scenarios.
- Real-World Data: Keystone Realtors Limited’s financials pre-loaded to facilitate your analysis.
- Automated DCF Outputs: The model computes Net Present Value (NPV) and intrinsic value for you automatically.
- Tailored and Professional: A sleek Excel model designed to meet your valuation requirements.
- Designed for Analysts and Investors: Perfect for evaluating projections, confirming strategies, and optimizing time efficiency.
Key Features
- Customizable Forecast Variables: Adjust essential factors such as revenue growth, EBITDA percentage, and capital investments.
- Instant DCF Valuation: Quickly computes intrinsic value, NPV, and various financial metrics.
- High-Precision Accuracy: Leverages real-world financial data from Keystone Realtors Limited (RUSTOMJEENS) for realistic valuation results.
- Streamlined Scenario Analysis: Effortlessly evaluate different assumptions and assess their impact on outcomes.
- Efficiency Booster: Removes the need for creating intricate valuation models from the ground up.
How It Works
- Step 1: Download the prebuilt Excel template featuring Keystone Realtors Limited’s (RUSTOMJEENS) data.
- Step 2: Navigate through the pre-filled sheets to familiarize yourself with the essential metrics.
- Step 3: Modify projections and assumptions in the editable yellow cells (WACC, growth, margins).
- Step 4: Instantly view the updated results, including Keystone Realtors Limited’s (RUSTOMJEENS) intrinsic value.
- Step 5: Utilize the outputs to make informed investment decisions or create detailed reports.
Why Choose the RUSTOMJEENS Calculator?
- Designed for Industry Experts: A sophisticated tool favored by real estate analysts, CFOs, and consultants.
- Comprehensive Data: RUSTOMJEENS’ historical and projected financials preloaded for enhanced precision.
- Versatile Scenario Analysis: Effortlessly simulate various forecasts and assumptions.
- Transparent Outputs: Automatically computes intrinsic value, NPV, and essential metrics.
- User-Friendly Experience: Clear, step-by-step guidance to facilitate your calculations.
Who Can Benefit from Keystone Realtors Limited (RUSTOMJEENS)?
- Real Estate Investors: Make informed choices with our comprehensive property valuation tools.
- Property Analysts: Streamline your analysis process with our customizable market assessment templates.
- Consultants: Effortlessly tailor presentations and reports for your clients using our pre-designed resources.
- Real Estate Enthusiasts: Enhance your knowledge of property valuation methods with real-life case studies.
- Educators and Students: Utilize our resources as effective learning aids in real estate and finance courses.
What the Template Offers
- Pre-Filled DCF Model: RUSTOMJEENS’ financial data preloaded for immediate analysis.
- WACC Calculator: Comprehensive calculations for Weighted Average Cost of Capital.
- Financial Ratios: Assess RUSTOMJEENS' profitability, leverage, and operational efficiency.
- Editable Inputs: Tailor assumptions like growth rates, profit margins, and CAPEX to suit your scenarios.
- Financial Statements: Access annual and quarterly reports for in-depth evaluation.
- Interactive Dashboard: Effortlessly visualize essential valuation metrics and outcomes.
Disclaimer
All information, articles, and product details provided on this website are for general informational and educational purposes only. We do not claim any ownership over, nor do we intend to infringe upon, any trademarks, copyrights, logos, brand names, or other intellectual property mentioned or depicted on this site. Such intellectual property remains the property of its respective owners, and any references here are made solely for identification or informational purposes, without implying any affiliation, endorsement, or partnership.
We make no representations or warranties, express or implied, regarding the accuracy, completeness, or suitability of any content or products presented. Nothing on this website should be construed as legal, tax, investment, financial, medical, or other professional advice. In addition, no part of this site—including articles or product references—constitutes a solicitation, recommendation, endorsement, advertisement, or offer to buy or sell any securities, franchises, or other financial instruments, particularly in jurisdictions where such activity would be unlawful.
All content is of a general nature and may not address the specific circumstances of any individual or entity. It is not a substitute for professional advice or services. Any actions you take based on the information provided here are strictly at your own risk. You accept full responsibility for any decisions or outcomes arising from your use of this website and agree to release us from any liability in connection with your use of, or reliance upon, the content or products found herein.