
|
Riverview Bancorp, Inc. (RVSB) Avaliação DCF |
Totalmente Editável: Adapte-Se Às Suas Necessidades No Excel Ou Planilhas
Design Profissional: Modelos Confiáveis E Padrão Da Indústria
Pré-Construídos Para Uso Rápido E Eficiente
Compatível com MAC/PC, totalmente desbloqueado
Não É Necessária Experiência; Fácil De Seguir
Riverview Bancorp, Inc. (RVSB) Bundle
Descubra o verdadeiro valor do Riverview Bancorp, Inc. (RVSB) com nossa calculadora DCF avançada! Ajuste as principais suposições, explore vários cenários e avalie como as mudanças afetam a avaliação do Riverview Bancorp - tudo dentro de um modelo conveniente do Excel.
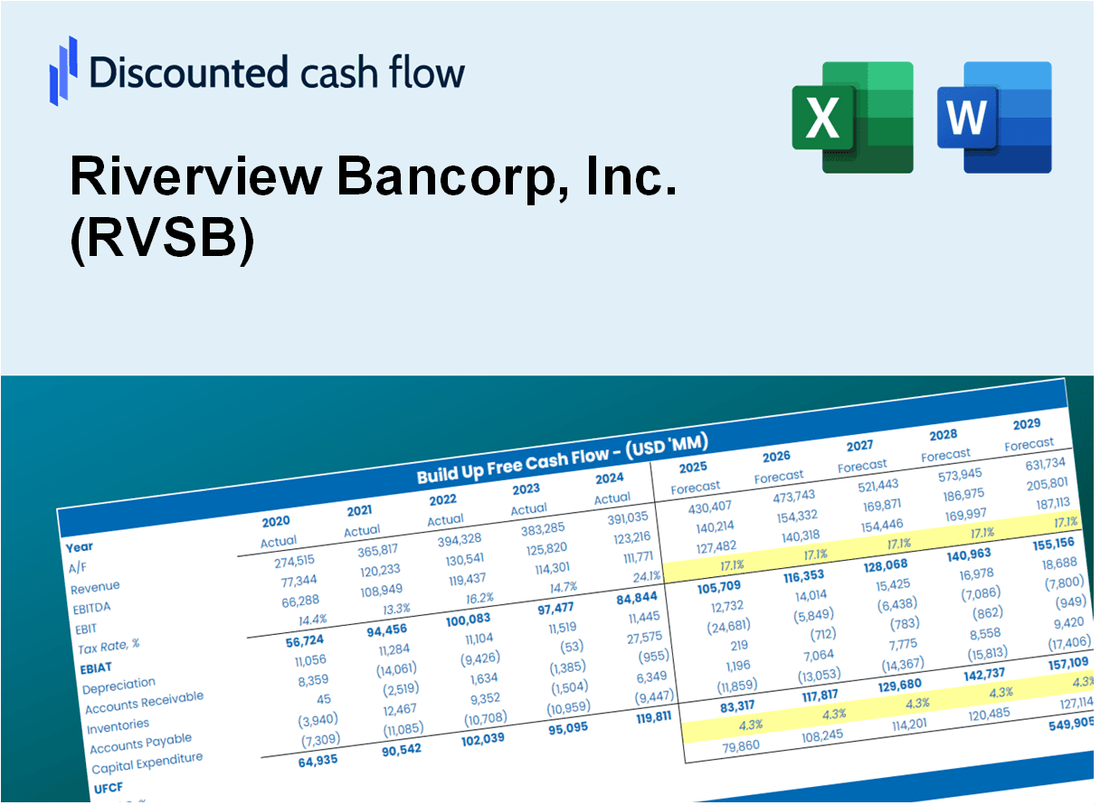
Discounted Cash Flow (DCF) - (USD MM)
| Year | AY1 2021 |
AY2 2022 |
AY3 2023 |
AY4 2024 |
AY5 2025 |
FY1 2026 |
FY2 2027 |
FY3 2028 |
FY4 2029 |
FY5 2030 |
|---|---|---|---|---|---|---|---|---|---|---|
| Revenue | 59.4 | 62.6 | 67.9 | 66.8 | 73.2 | 77.2 | 81.4 | 85.8 | 90.5 | 95.4 |
| Revenue Growth, % | 0 | 5.27 | 8.46 | -1.57 | 9.61 | 5.44 | 5.44 | 5.44 | 5.44 | 5.44 |
| EBITDA | 16.7 | 31.8 | 26.4 | 7.4 | 9.6 | 21.9 | 23.1 | 24.3 | 25.7 | 27.1 |
| EBITDA, % | 28.04 | 50.82 | 38.86 | 11.02 | 13.06 | 28.36 | 28.36 | 28.36 | 28.36 | 28.36 |
| Depreciation | 3.2 | 3.5 | 2.7 | 2.8 | 3.3 | 3.7 | 3.9 | 4.1 | 4.3 | 4.5 |
| Depreciation, % | 5.4 | 5.63 | 3.97 | 4.13 | 4.54 | 4.74 | 4.74 | 4.74 | 4.74 | 4.74 |
| EBIT | 13.5 | 28.3 | 23.7 | 4.6 | 6.2 | 18.2 | 19.2 | 20.3 | 21.4 | 22.5 |
| EBIT, % | 22.64 | 45.19 | 34.89 | 6.89 | 8.52 | 23.63 | 23.63 | 23.63 | 23.63 | 23.63 |
| Total Cash | 482.0 | 407.5 | 233.8 | 166.8 | 43.5 | 70.9 | 74.8 | 78.9 | 83.2 | 87.7 |
| Total Cash, percent | .0 | .0 | .0 | .0 | .0 | .0 | .0 | .0 | .0 | .0 |
| Account Receivables | 5.2 | 4.7 | 4.8 | 4.4 | 4.5 | 5.6 | 5.9 | 6.2 | 6.5 | 6.9 |
| Account Receivables, % | 8.81 | 7.43 | 7.06 | 6.61 | 6.18 | 7.22 | 7.22 | 7.22 | 7.22 | 7.22 |
| Inventories | .0 | .0 | .0 | .0 | .0 | .0 | .0 | .0 | .0 | .0 |
| Inventories, % | 0 | 0 | 0 | 0 | 0 | 0 | 0 | 0 | 0 | 0 |
| Accounts Payable | .0 | .0 | .0 | .0 | .0 | .0 | .0 | .0 | .0 | .0 |
| Accounts Payable, % | 0 | 0 | 0 | 0 | 0 | 0 | 0 | 0 | 0 | 0 |
| Capital Expenditure | -3.6 | -3.3 | -5.0 | -5.6 | -2.7 | -4.7 | -5.0 | -5.3 | -5.5 | -5.8 |
| Capital Expenditure, % | -5.98 | -5.2 | -7.32 | -8.4 | -3.71 | -6.12 | -6.12 | -6.12 | -6.12 | -6.12 |
| Tax Rate, % | 21.4 | 21.4 | 21.4 | 21.4 | 21.4 | 21.4 | 21.4 | 21.4 | 21.4 | 21.4 |
| EBITAT | 10.5 | 21.8 | 18.1 | 3.8 | 4.9 | 14.3 | 15.1 | 15.9 | 16.8 | 17.7 |
| Depreciation | ||||||||||
| Changes in Account Receivables | ||||||||||
| Changes in Inventories | ||||||||||
| Changes in Accounts Payable | ||||||||||
| Capital Expenditure | ||||||||||
| UFCF | 4.9 | 22.7 | 15.7 | 1.3 | 5.4 | 12.2 | 13.7 | 14.4 | 15.2 | 16.0 |
| WACC, % | 11.49 | 11.42 | 11.33 | 11.98 | 11.57 | 11.56 | 11.56 | 11.56 | 11.56 | 11.56 |
| PV UFCF | ||||||||||
| SUM PV UFCF | 51.4 | |||||||||
| Long Term Growth Rate, % | 2.00 | |||||||||
| Free cash flow (T + 1) | 16 | |||||||||
| Terminal Value | 171 | |||||||||
| Present Terminal Value | 99 | |||||||||
| Enterprise Value | 150 | |||||||||
| Net Debt | 76 | |||||||||
| Equity Value | 74 | |||||||||
| Diluted Shares Outstanding, MM | 21 | |||||||||
| Equity Value Per Share | 3.52 |
What You Will Get
- Real RVSB Financials: Access to historical and projected data for precise valuation.
- Customizable Inputs: Adjust WACC, tax rates, revenue growth, and capital expenditures as needed.
- Dynamic Calculations: Intrinsic value and NPV are computed in real-time.
- Scenario Analysis: Evaluate various scenarios to assess Riverview Bancorp's future performance.
- User-Friendly Design: Designed for professionals while remaining approachable for newcomers.
Key Features
- Comprehensive Financial Data: Gain access to precise historical information and future forecasts for Riverview Bancorp, Inc. (RVSB).
- Adjustable Forecast Parameters: Modify highlighted fields such as WACC, growth rates, and profit margins.
- Real-Time Calculations: Automatic recalculations for DCF, Net Present Value (NPV), and cash flow assessments.
- User-Friendly Dashboard: Intuitive charts and summaries to easily interpret your valuation findings.
- Designed for All Skill Levels: An accessible and straightforward layout tailored for investors, CFOs, and consultants alike.
How It Works
- Step 1: Download the Excel file.
- Step 2: Review pre-entered Riverview Bancorp, Inc. (RVSB) data (historical and projected).
- Step 3: Adjust key assumptions (yellow cells) based on your analysis.
- Step 4: View automatic recalculations for Riverview Bancorp, Inc. (RVSB)’s intrinsic value.
- Step 5: Use the outputs for investment decisions or reporting.
Why Choose This Calculator for Riverview Bancorp, Inc. (RVSB)?
- Accuracy: Utilizes real Riverview Bancorp financials for precise data.
- Flexibility: Tailored for users to easily adjust and experiment with inputs.
- Time-Saving: Eliminate the need to create a financial model from the ground up.
- Professional-Grade: Crafted with the expertise and usability expected by CFOs.
- User-Friendly: Simple to navigate, even for those without extensive financial modeling skills.
Who Should Use This Product?
- Investors: Evaluate Riverview Bancorp, Inc.'s (RVSB) financial health before making investment decisions.
- CFOs and Financial Analysts: Optimize valuation methodologies and validate financial forecasts for Riverview Bancorp, Inc. (RVSB).
- Startup Founders: Gain insights into how community banks like Riverview Bancorp, Inc. (RVSB) are assessed in the market.
- Consultants: Provide comprehensive valuation analyses and reports to clients in the banking sector.
- Students and Educators: Utilize real-time data from Riverview Bancorp, Inc. (RVSB) to teach and practice financial valuation skills.
What the Template Contains
- Preloaded RVSB Data: Historical and projected financial data, including revenue, net income, and loan performance metrics.
- DCF and WACC Models: Professional-grade sheets for calculating intrinsic value and Weighted Average Cost of Capital.
- Editable Inputs: Yellow-highlighted cells for adjusting interest rates, growth assumptions, and discount rates.
- Financial Statements: Comprehensive annual and quarterly financials for deeper analysis.
- Key Ratios: Profitability, liquidity, and asset management ratios to evaluate performance.
- Dashboard and Charts: Visual summaries of valuation outcomes and key financial assumptions.
Disclaimer
All information, articles, and product details provided on this website are for general informational and educational purposes only. We do not claim any ownership over, nor do we intend to infringe upon, any trademarks, copyrights, logos, brand names, or other intellectual property mentioned or depicted on this site. Such intellectual property remains the property of its respective owners, and any references here are made solely for identification or informational purposes, without implying any affiliation, endorsement, or partnership.
We make no representations or warranties, express or implied, regarding the accuracy, completeness, or suitability of any content or products presented. Nothing on this website should be construed as legal, tax, investment, financial, medical, or other professional advice. In addition, no part of this site—including articles or product references—constitutes a solicitation, recommendation, endorsement, advertisement, or offer to buy or sell any securities, franchises, or other financial instruments, particularly in jurisdictions where such activity would be unlawful.
All content is of a general nature and may not address the specific circumstances of any individual or entity. It is not a substitute for professional advice or services. Any actions you take based on the information provided here are strictly at your own risk. You accept full responsibility for any decisions or outcomes arising from your use of this website and agree to release us from any liability in connection with your use of, or reliance upon, the content or products found herein.