
|
Safestore Holdings PLC (Safe.L) DCF Avaliação |
Totalmente Editável: Adapte-Se Às Suas Necessidades No Excel Ou Planilhas
Design Profissional: Modelos Confiáveis E Padrão Da Indústria
Pré-Construídos Para Uso Rápido E Eficiente
Compatível com MAC/PC, totalmente desbloqueado
Não É Necessária Experiência; Fácil De Seguir
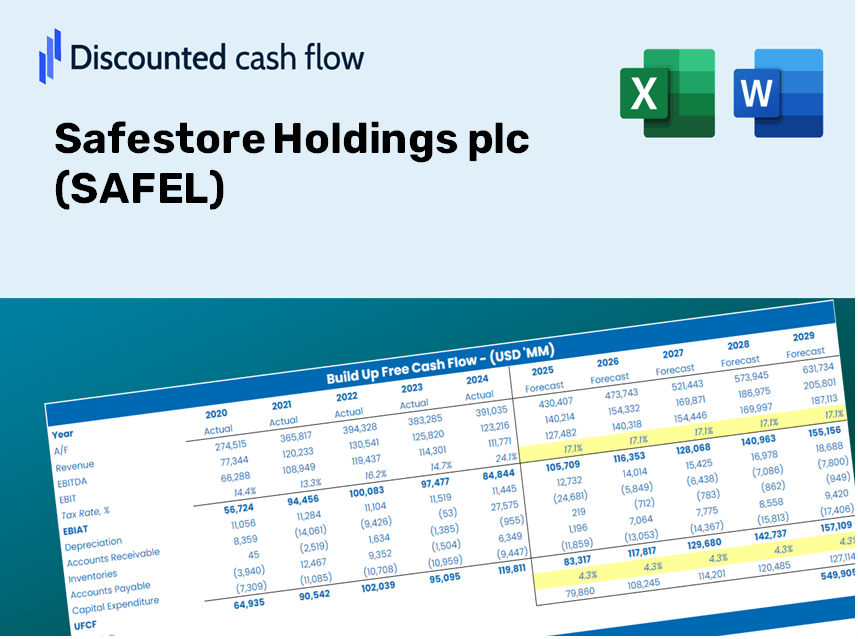
Safestore Holdings plc (SAFE.L) Bundle
Avalie as perspectivas financeiras da Safestore Holdings PLC como um especialista! Essa calculadora do Safel DCF fornece dados financeiros pré-preenchidos e oferece total flexibilidade para modificar o crescimento da receita, o WACC, as margens e outras suposições essenciais para se alinhar às suas previsões.
Discounted Cash Flow (DCF) - (USD MM)
| Year | AY1 2020 |
AY2 2021 |
AY3 2022 |
AY4 2023 |
AY5 2024 |
FY1 2025 |
FY2 2026 |
FY3 2027 |
FY4 2028 |
FY5 2029 |
|---|---|---|---|---|---|---|---|---|---|---|
| Revenue | 162.3 | 186.8 | 212.5 | 224.2 | 223.5 | 242.5 | 263.2 | 285.6 | 309.9 | 336.3 |
| Revenue Growth, % | 0 | 15.1 | 13.76 | 5.51 | -0.31222 | 8.51 | 8.51 | 8.51 | 8.51 | 8.51 |
| EBITDA | 87.2 | 102.2 | 124.5 | 229.5 | 425.8 | 178.0 | 193.2 | 209.6 | 227.5 | 246.8 |
| EBITDA, % | 53.73 | 54.71 | 58.59 | 102.36 | 190.51 | 73.41 | 73.41 | 73.41 | 73.41 | 73.41 |
| Depreciation | .9 | 1.0 | 1.0 | 1.3 | 1.5 | 1.4 | 1.5 | 1.6 | 1.7 | 1.9 |
| Depreciation, % | 0.55453 | 0.53533 | 0.47059 | 0.57984 | 0.67114 | 0.56229 | 0.56229 | 0.56229 | 0.56229 | 0.56229 |
| EBIT | 86.3 | 101.2 | 123.5 | 228.2 | 424.3 | 177.3 | 192.4 | 208.7 | 226.5 | 245.8 |
| EBIT, % | 53.17 | 54.18 | 58.12 | 101.78 | 189.84 | 73.09 | 73.09 | 73.09 | 73.09 | 73.09 |
| Total Cash | 19.6 | 43.2 | 20.9 | 16.9 | 25.3 | 31.0 | 33.6 | 36.5 | 39.6 | 43.0 |
| Total Cash, percent | .0 | .0 | .0 | .0 | .0 | .0 | .0 | .0 | .0 | .0 |
| Account Receivables | 17.0 | 23.6 | 24.0 | 16.0 | 22.6 | 25.1 | 27.2 | 29.5 | 32.0 | 34.7 |
| Account Receivables, % | 10.47 | 12.63 | 11.29 | 7.14 | 10.11 | 10.33 | 10.33 | 10.33 | 10.33 | 10.33 |
| Inventories | .3 | .5 | .3 | .4 | .4 | .5 | .5 | .5 | .6 | .6 |
| Inventories, % | 0.18484 | 0.26767 | 0.14118 | 0.17841 | 0.17897 | 0.19021 | 0.19021 | 0.19021 | 0.19021 | 0.19021 |
| Accounts Payable | 8.0 | 22.7 | 8.0 | 9.4 | 10.1 | 14.3 | 15.6 | 16.9 | 18.3 | 19.9 |
| Accounts Payable, % | 4.93 | 12.15 | 3.76 | 4.19 | 4.52 | 5.91 | 5.91 | 5.91 | 5.91 | 5.91 |
| Capital Expenditure | -1.3 | -1.0 | -96.2 | -121.9 | -120.1 | -75.0 | -81.4 | -88.4 | -95.9 | -104.0 |
| Capital Expenditure, % | -0.80099 | -0.53533 | -45.27 | -54.37 | -53.74 | -30.94 | -30.94 | -30.94 | -30.94 | -30.94 |
| Tax Rate, % | 6.6 | 6.6 | 6.6 | 6.6 | 6.6 | 6.6 | 6.6 | 6.6 | 6.6 | 6.6 |
| EBITAT | 77.6 | 95.5 | 114.5 | 219.9 | 396.3 | 165.5 | 179.6 | 194.9 | 211.5 | 229.5 |
| Depreciation | ||||||||||
| Changes in Account Receivables | ||||||||||
| Changes in Inventories | ||||||||||
| Changes in Accounts Payable | ||||||||||
| Capital Expenditure | ||||||||||
| UFCF | 67.9 | 103.4 | 4.4 | 108.6 | 271.8 | 93.6 | 98.7 | 107.1 | 116.2 | 126.1 |
| WACC, % | 6.85 | 6.91 | 6.89 | 6.94 | 6.9 | 6.9 | 6.9 | 6.9 | 6.9 | 6.9 |
| PV UFCF | ||||||||||
| SUM PV UFCF | 440.9 | |||||||||
| Long Term Growth Rate, % | 2.00 | |||||||||
| Free cash flow (T + 1) | 129 | |||||||||
| Terminal Value | 2,627 | |||||||||
| Present Terminal Value | 1,882 | |||||||||
| Enterprise Value | 2,323 | |||||||||
| Net Debt | 900 | |||||||||
| Equity Value | 1,423 | |||||||||
| Diluted Shares Outstanding, MM | 219 | |||||||||
| Equity Value Per Share | 649.05 |
What You Will Receive
- Authentic SAFEL Financial Data: Pre-populated with Safestore Holdings plc’s historical and projected figures for accurate analysis.
- Completely Customizable Template: Easily adjust essential variables such as revenue growth, WACC, and EBITDA margin.
- Instant Calculations: Watch as the intrinsic value of Safestore updates immediately in response to your modifications.
- Professional Valuation Tool: Tailored for investors, analysts, and consultants looking for reliable DCF outcomes.
- User-Friendly Interface: Straightforward layout and clear guidance suitable for all expertise levels.
Key Features
- Real-Time SAFEL Data: Pre-loaded with Safestore Holdings plc's historical financial performance and future outlooks.
- Customizable Parameters: Modify revenue growth rates, operating margins, WACC, tax rates, and capital expenditure assumptions.
- Interactive Valuation Model: Instantaneous recalculations of Net Present Value (NPV) and intrinsic value based on your adjustments.
- Scenario Analysis: Develop various forecasting scenarios to assess different valuation possibilities.
- Intuitive Interface: Designed for ease of use, making it accessible for both seasoned professionals and newcomers.
How It Works
- Download: Obtain the pre-prepared Excel file containing Safestore Holdings plc’s (SAFEL) financial information.
- Customize: Modify projections, including revenue growth, EBITDA %, and WACC.
- Update Automatically: The intrinsic value and NPV calculations refresh in real-time.
- Test Scenarios: Generate multiple forecasts and compare results instantly.
- Make Decisions: Leverage the valuation findings to inform your investment strategy.
Why Opt for Safestore Holdings plc (SAFEL) Calculator?
- Time Efficient: Skip the hassle of building a DCF model from the ground up – our tool is pre-configured for immediate use.
- Enhanced Accuracy: Dependable financial data and comprehensive formulas minimize valuation errors.
- Completely Customizable: Adjust the model to align with your specific assumptions and forecasts.
- User-Friendly: Intuitive charts and outputs simplify result analysis.
- Endorsed by Professionals: Crafted for experts who prioritize accuracy and functionality.
Who Can Benefit from This Product?
- Finance Students: Master valuation techniques and practice with actual market data.
- Researchers: Integrate professional valuation models into your studies or projects.
- Investors: Validate your hypotheses and evaluate the valuation outcomes for Safestore Holdings plc (SAFEL).
- Financial Analysts: Enhance your efficiency with a ready-made, customizable DCF model.
- Small Business Entrepreneurs: Understand the analytical approaches applied to large public companies like Safestore Holdings plc (SAFEL).
Contents of the Template
- Operating and Balance Sheet Data: Pre-filled historical data and forecasts for Safestore Holdings plc (SAFEL), including revenue, EBITDA, EBIT, and capital expenditures.
- WACC Calculation: A dedicated sheet for calculating the Weighted Average Cost of Capital (WACC), featuring essential parameters such as Beta, risk-free rate, and share price.
- DCF Valuation (Unlevered and Levered): Customizable Discounted Cash Flow models that illustrate intrinsic value with comprehensive calculations.
- Financial Statements: Pre-loaded financial statements (both annual and quarterly) to facilitate thorough analysis.
- Key Ratios: Important profitability, leverage, and efficiency ratios specific to Safestore Holdings plc (SAFEL).
- Dashboard and Charts: A visual summary of valuation outputs and underlying assumptions to simplify analysis of results.
Disclaimer
All information, articles, and product details provided on this website are for general informational and educational purposes only. We do not claim any ownership over, nor do we intend to infringe upon, any trademarks, copyrights, logos, brand names, or other intellectual property mentioned or depicted on this site. Such intellectual property remains the property of its respective owners, and any references here are made solely for identification or informational purposes, without implying any affiliation, endorsement, or partnership.
We make no representations or warranties, express or implied, regarding the accuracy, completeness, or suitability of any content or products presented. Nothing on this website should be construed as legal, tax, investment, financial, medical, or other professional advice. In addition, no part of this site—including articles or product references—constitutes a solicitation, recommendation, endorsement, advertisement, or offer to buy or sell any securities, franchises, or other financial instruments, particularly in jurisdictions where such activity would be unlawful.
All content is of a general nature and may not address the specific circumstances of any individual or entity. It is not a substitute for professional advice or services. Any actions you take based on the information provided here are strictly at your own risk. You accept full responsibility for any decisions or outcomes arising from your use of this website and agree to release us from any liability in connection with your use of, or reliance upon, the content or products found herein.