
|
ECHOSTAR CORPORATION (SATS) Avaliação DCF |
Totalmente Editável: Adapte-Se Às Suas Necessidades No Excel Ou Planilhas
Design Profissional: Modelos Confiáveis E Padrão Da Indústria
Pré-Construídos Para Uso Rápido E Eficiente
Compatível com MAC/PC, totalmente desbloqueado
Não É Necessária Experiência; Fácil De Seguir
EchoStar Corporation (SATS) Bundle
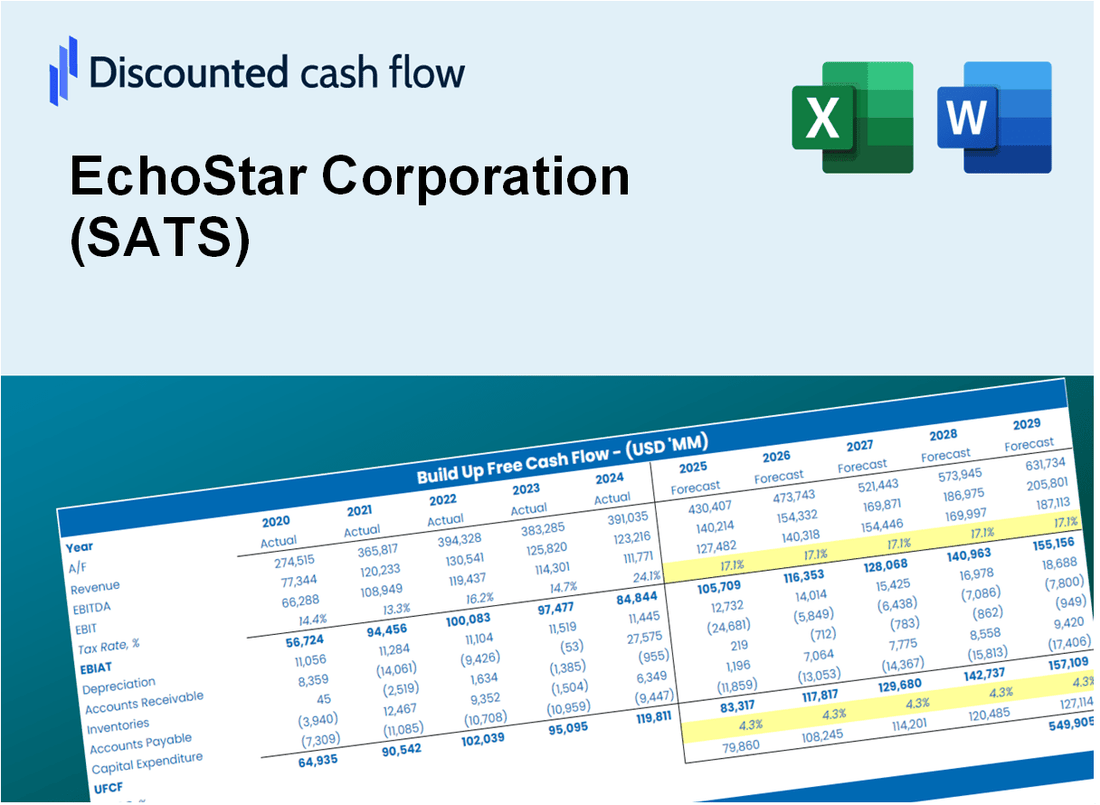
Projetado para precisão, a nossa calculadora DCF da Echostar Corporation (SATS) capacita você a avaliar a avaliação de EchoStar usando dados financeiros do mundo real, oferecendo flexibilidade completa para modificar todos os parâmetros essenciais para obter projeções aprimoradas.
Discounted Cash Flow (DCF) - (USD MM)
| Year | AY1 2020 |
AY2 2021 |
AY3 2022 |
AY4 2023 |
AY5 2024 |
FY1 2025 |
FY2 2026 |
FY3 2027 |
FY4 2028 |
FY5 2029 |
|---|---|---|---|---|---|---|---|---|---|---|
| Revenue | 1,887.9 | 1,985.7 | 1,998.1 | 17,015.6 | 15,825.5 | 19,734.8 | 24,609.8 | 30,689.1 | 38,270.0 | 47,723.7 |
| Revenue Growth, % | 0 | 5.18 | 0.6231 | 751.59 | -6.99 | 24.7 | 24.7 | 24.7 | 24.7 | 24.7 |
| EBITDA | 746.4 | 715.2 | 4,589.4 | -247.4 | 2,336.2 | 7,454.2 | 9,295.6 | 11,591.9 | 14,455.4 | 18,026.2 |
| EBITDA, % | 39.53 | 36.02 | 229.69 | -1.45 | 14.76 | 37.77 | 37.77 | 37.77 | 37.77 | 37.77 |
| Depreciation | 626.3 | 491.3 | 1,174.9 | 1,597.9 | 1,930.2 | 5,458.9 | 6,807.3 | 8,488.9 | 10,585.9 | 13,200.9 |
| Depreciation, % | 33.17 | 24.74 | 58.8 | 9.39 | 12.2 | 27.66 | 27.66 | 27.66 | 27.66 | 27.66 |
| EBIT | 120.1 | 223.9 | 3,414.5 | -1,845.3 | 406.1 | 4,316.2 | 5,382.4 | 6,712.0 | 8,370.1 | 10,437.7 |
| EBIT, % | 6.36 | 11.27 | 170.89 | -10.84 | 2.57 | 21.87 | 21.87 | 21.87 | 21.87 | 21.87 |
| Total Cash | 2,534.3 | 1,546.4 | 4,307.4 | 2,444.4 | 5,547.4 | 12,918.2 | 16,109.3 | 20,088.7 | 25,051.2 | 31,239.4 |
| Total Cash, percent | .0 | .0 | .0 | .0 | .0 | .0 | .0 | .0 | .0 | .0 |
| Account Receivables | 189.6 | 199.0 | 1,182.6 | 1,122.1 | 1,198.7 | 3,687.3 | 4,598.1 | 5,734.0 | 7,150.4 | 8,916.8 |
| Account Receivables, % | 10.04 | 10.02 | 59.19 | 6.59 | 7.57 | 18.68 | 18.68 | 18.68 | 18.68 | 18.68 |
| Inventories | 98.0 | 103.1 | 626.0 | 665.2 | 455.2 | 1,914.1 | 2,387.0 | 2,976.6 | 3,711.9 | 4,628.8 |
| Inventories, % | 5.19 | 5.19 | 31.33 | 3.91 | 2.88 | 9.7 | 9.7 | 9.7 | 9.7 | 9.7 |
| Accounts Payable | 123.1 | 109.8 | 1,023.5 | 774.0 | 741.0 | 2,861.9 | 3,568.9 | 4,450.5 | 5,549.9 | 6,920.9 |
| Accounts Payable, % | 6.52 | 5.53 | 51.23 | 4.55 | 4.68 | 14.5 | 14.5 | 14.5 | 14.5 | 14.5 |
| Capital Expenditure | -447.5 | -472.0 | -349.0 | -3,100.9 | -1,544.9 | -3,667.6 | -4,573.6 | -5,703.4 | -7,112.2 | -8,869.1 |
| Capital Expenditure, % | -23.7 | -23.77 | -17.47 | -18.22 | -9.76 | -18.58 | -18.58 | -18.58 | -18.58 | -18.58 |
| Tax Rate, % | -58.19 | -58.19 | -58.19 | -58.19 | -58.19 | -58.19 | -58.19 | -58.19 | -58.19 | -58.19 |
| EBITAT | 223.9 | 127.1 | 2,592.1 | -1,625.9 | 642.3 | 3,632.6 | 4,529.9 | 5,649.0 | 7,044.4 | 8,784.5 |
| Depreciation | ||||||||||
| Changes in Account Receivables | ||||||||||
| Changes in Inventories | ||||||||||
| Changes in Accounts Payable | ||||||||||
| Capital Expenditure | ||||||||||
| UFCF | 238.3 | 118.7 | 2,825.2 | -3,357.2 | 1,128.0 | 3,597.3 | 6,087.0 | 7,590.6 | 9,465.7 | 11,804.0 |
| WACC, % | 5.58 | 4.63 | 5.05 | 5.32 | 5.58 | 5.23 | 5.23 | 5.23 | 5.23 | 5.23 |
| PV UFCF | ||||||||||
| SUM PV UFCF | 32,295.0 | |||||||||
| Long Term Growth Rate, % | 3.50 | |||||||||
| Free cash flow (T + 1) | 12,217 | |||||||||
| Terminal Value | 705,259 | |||||||||
| Present Terminal Value | 546,517 | |||||||||
| Enterprise Value | 578,812 | |||||||||
| Net Debt | 25,509 | |||||||||
| Equity Value | 553,302 | |||||||||
| Diluted Shares Outstanding, MM | 274 | |||||||||
| Equity Value Per Share | 2,018.77 |
What You Will Get
- Real SATS Financials: Access historical and projected data for precise valuation.
- Customizable Inputs: Adjust WACC, tax rates, revenue growth, and capital expenditures as needed.
- Dynamic Calculations: Intrinsic value and NPV are computed automatically.
- Scenario Analysis: Evaluate various scenarios to assess EchoStar's future performance.
- User-Friendly Design: Designed for professionals while remaining easy for beginners to navigate.
Key Features
- 🔍 Real-Life SATS Financials: Pre-filled historical and projected data for EchoStar Corporation (SATS).
- ✏️ Fully Customizable Inputs: Adjust all critical parameters (yellow cells) like WACC, growth %, and tax rates.
- 📊 Professional DCF Valuation: Built-in formulas calculate EchoStar’s intrinsic value using the Discounted Cash Flow method.
- ⚡ Instant Results: Visualize EchoStar’s valuation instantly after making changes.
- Scenario Analysis: Test and compare outcomes for various financial assumptions side-by-side.
How It Works
- Step 1: Download the Excel file.
- Step 2: Review EchoStar Corporation's (SATS) pre-filled financial data and forecasts.
- Step 3: Modify key inputs such as revenue growth, WACC, and tax rates (highlighted cells).
- Step 4: Observe the DCF model update in real-time as you adjust the assumptions.
- Step 5: Analyze the outputs and leverage the results for your investment strategies.
Why Choose This Calculator for EchoStar Corporation (SATS)?
- Designed for Experts: A sophisticated tool utilized by analysts, CFOs, and financial consultants.
- Accurate Data: EchoStar’s historical and forecasted financials are preloaded for precise calculations.
- Flexible Scenario Analysis: Effortlessly simulate various forecasts and assumptions.
- Transparent Results: Automatically computes intrinsic value, NPV, and essential metrics.
- User-Friendly: Comprehensive step-by-step instructions help you navigate the process.
Who Should Use This Product?
- Individual Investors: Make informed decisions about buying or selling EchoStar Corporation (SATS) stock.
- Financial Analysts: Streamline valuation processes with ready-to-use financial models for EchoStar Corporation (SATS).
- Consultants: Deliver professional valuation insights on EchoStar Corporation (SATS) to clients quickly and accurately.
- Business Owners: Understand how companies like EchoStar Corporation (SATS) are valued to guide your own strategy.
- Finance Students: Learn valuation techniques using real-world data and scenarios related to EchoStar Corporation (SATS).
What the Template Contains
- Pre-Filled Data: Contains EchoStar Corporation's historical financials and projections.
- Discounted Cash Flow Model: An editable DCF valuation model featuring automatic calculations.
- Weighted Average Cost of Capital (WACC): A dedicated sheet for computing WACC using customized inputs.
- Key Financial Ratios: Evaluate EchoStar's profitability, efficiency, and leverage metrics.
- Customizable Inputs: Easily adjust revenue growth, profit margins, and tax rates.
- Clear Dashboard: Visual representations and tables summarizing essential valuation outcomes.
Disclaimer
All information, articles, and product details provided on this website are for general informational and educational purposes only. We do not claim any ownership over, nor do we intend to infringe upon, any trademarks, copyrights, logos, brand names, or other intellectual property mentioned or depicted on this site. Such intellectual property remains the property of its respective owners, and any references here are made solely for identification or informational purposes, without implying any affiliation, endorsement, or partnership.
We make no representations or warranties, express or implied, regarding the accuracy, completeness, or suitability of any content or products presented. Nothing on this website should be construed as legal, tax, investment, financial, medical, or other professional advice. In addition, no part of this site—including articles or product references—constitutes a solicitation, recommendation, endorsement, advertisement, or offer to buy or sell any securities, franchises, or other financial instruments, particularly in jurisdictions where such activity would be unlawful.
All content is of a general nature and may not address the specific circumstances of any individual or entity. It is not a substitute for professional advice or services. Any actions you take based on the information provided here are strictly at your own risk. You accept full responsibility for any decisions or outcomes arising from your use of this website and agree to release us from any liability in connection with your use of, or reliance upon, the content or products found herein.