
|
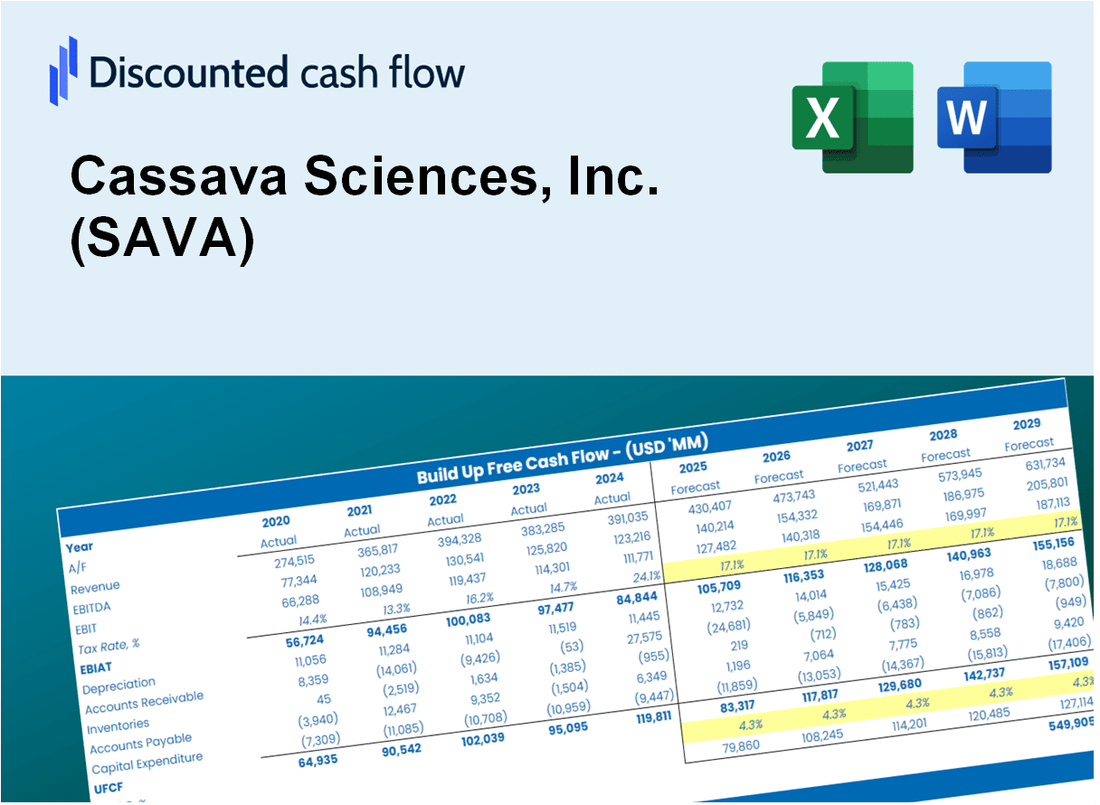
Cassava Sciences, Inc. (SAVA) Avaliação DCF |
Totalmente Editável: Adapte-Se Às Suas Necessidades No Excel Ou Planilhas
Design Profissional: Modelos Confiáveis E Padrão Da Indústria
Pré-Construídos Para Uso Rápido E Eficiente
Compatível com MAC/PC, totalmente desbloqueado
Não É Necessária Experiência; Fácil De Seguir
Cassava Sciences, Inc. (SAVA) Bundle
Projetado para precisão, nossa calculadora DCF (SAVA) permite avaliar a avaliação da Cassava Sciences, Inc. com dados financeiros do mundo real e flexibilidade completa para modificar todos os parâmetros essenciais para melhorar projeções.
What You Will Get
- Real SAVA Financial Data: Pre-filled with Cassava Sciences' historical and projected data for precise analysis.
- Fully Editable Template: Modify key inputs like revenue growth, WACC, and EBITDA % with ease.
- Automatic Calculations: See Cassava Sciences' intrinsic value update instantly based on your changes.
- Professional Valuation Tool: Designed for investors, analysts, and consultants seeking accurate DCF results.
- User-Friendly Design: Simple structure and clear instructions for all experience levels.
Key Features
- Comprehensive DCF Calculator: Features detailed unlevered and levered DCF valuation models tailored for Cassava Sciences, Inc. (SAVA).
- WACC Calculator: Pre-configured Weighted Average Cost of Capital sheet with adjustable inputs specific to SAVA.
- Customizable Forecast Assumptions: Adjust growth rates, capital expenditures, and discount rates as needed.
- Integrated Financial Ratios: Evaluate profitability, leverage, and efficiency ratios for Cassava Sciences, Inc. (SAVA).
- Interactive Dashboard and Charts: Visual representations summarize essential valuation metrics for straightforward analysis.
How It Works
- Step 1: Download the Excel file.
- Step 2: Review pre-entered Cassava Sciences data (historical and projected).
- Step 3: Adjust key assumptions (yellow cells) based on your analysis.
- Step 4: View automatic recalculations for Cassava Sciences’ intrinsic value.
- Step 5: Use the outputs for investment decisions or reporting.
Why Choose This Calculator for Cassava Sciences, Inc. (SAVA)?
- Accurate Data: Real Cassava Sciences financials provide dependable valuation outcomes.
- Customizable: Modify key metrics such as growth rates, WACC, and tax rates to align with your forecasts.
- Time-Saving: Pre-built calculations save you from starting from the ground up.
- Professional-Grade Tool: Tailored for investors, analysts, and consultants in the biotech sector.
- User-Friendly: Intuitive design and step-by-step guidance make it accessible for all users.
Who Should Use This Product?
- Biotech Students: Explore drug development processes and apply theoretical knowledge using real-world data.
- Researchers: Integrate innovative models into studies focusing on neurodegenerative diseases.
- Investors: Evaluate your own hypotheses and assess valuation metrics for Cassava Sciences, Inc. (SAVA).
- Market Analysts: Enhance your analysis with a customizable financial model tailored for biotech companies.
- Healthcare Professionals: Understand how public biotech firms like Cassava Sciences are evaluated in the market.
What the Template Contains
- Historical Data: Includes Cassava Sciences, Inc. (SAVA)’s past financials and baseline forecasts.
- DCF and Levered DCF Models: Detailed templates to calculate Cassava Sciences, Inc. (SAVA)’s intrinsic value.
- WACC Sheet: Pre-built calculations for Weighted Average Cost of Capital.
- Editable Inputs: Modify key drivers like growth rates, EBITDA %, and CAPEX assumptions.
- Quarterly and Annual Statements: A complete breakdown of Cassava Sciences, Inc. (SAVA)’s financials.
- Interactive Dashboard: Visualize valuation results and projections dynamically.
Disclaimer
All information, articles, and product details provided on this website are for general informational and educational purposes only. We do not claim any ownership over, nor do we intend to infringe upon, any trademarks, copyrights, logos, brand names, or other intellectual property mentioned or depicted on this site. Such intellectual property remains the property of its respective owners, and any references here are made solely for identification or informational purposes, without implying any affiliation, endorsement, or partnership.
We make no representations or warranties, express or implied, regarding the accuracy, completeness, or suitability of any content or products presented. Nothing on this website should be construed as legal, tax, investment, financial, medical, or other professional advice. In addition, no part of this site—including articles or product references—constitutes a solicitation, recommendation, endorsement, advertisement, or offer to buy or sell any securities, franchises, or other financial instruments, particularly in jurisdictions where such activity would be unlawful.
All content is of a general nature and may not address the specific circumstances of any individual or entity. It is not a substitute for professional advice or services. Any actions you take based on the information provided here are strictly at your own risk. You accept full responsibility for any decisions or outcomes arising from your use of this website and agree to release us from any liability in connection with your use of, or reliance upon, the content or products found herein.