
|
SBFC Finance Limited (SBFC.NS) Avaliação DCF |
Totalmente Editável: Adapte-Se Às Suas Necessidades No Excel Ou Planilhas
Design Profissional: Modelos Confiáveis E Padrão Da Indústria
Pré-Construídos Para Uso Rápido E Eficiente
Compatível com MAC/PC, totalmente desbloqueado
Não É Necessária Experiência; Fácil De Seguir
SBFC Finance Limited (SBFC.NS) Bundle
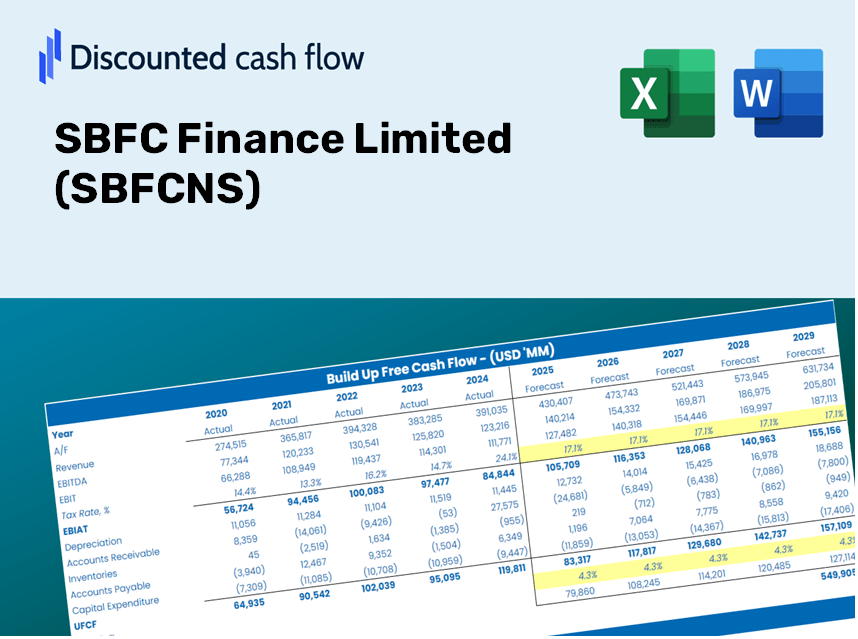
Avalie as perspectivas financeiras da SBFC Finance Limited (SBFCNS) com precisão especializada! Essa calculadora DCF para (SBFCNS) vem com dados financeiros pré-preenchidos e oferece total flexibilidade para modificar o crescimento da receita, WACC, margens e outras suposições críticas para se alinhar às suas projeções.
Discounted Cash Flow (DCF) - (USD MM)
| Year | AY1 2021 |
AY2 2022 |
AY3 2023 |
AY4 2024 |
AY5 2025 |
FY1 2026 |
FY2 2027 |
FY3 2028 |
FY4 2029 |
FY5 2030 |
|---|---|---|---|---|---|---|---|---|---|---|
| Revenue | 5,042.9 | 5,141.2 | 7,382.1 | 10,189.7 | 13,046.1 | 16,686.1 | 21,341.6 | 27,296.1 | 34,911.8 | 44,652.4 |
| Revenue Growth, % | 0 | 1.95 | 43.59 | 38.03 | 28.03 | 27.9 | 27.9 | 27.9 | 27.9 | 27.9 |
| EBITDA | 3,627.1 | 3,227.2 | 4,942.0 | 3,369.0 | 9,006.0 | 10,136.4 | 12,964.5 | 16,581.7 | 21,208.1 | 27,125.3 |
| EBITDA, % | 71.93 | 62.77 | 66.95 | 33.06 | 69.03 | 60.75 | 60.75 | 60.75 | 60.75 | 60.75 |
| Depreciation | 95.4 | 117.8 | 127.1 | 134.1 | 168.1 | 284.0 | 363.2 | 464.6 | 594.2 | 760.0 |
| Depreciation, % | 1.89 | 2.29 | 1.72 | 1.32 | 1.29 | 1.7 | 1.7 | 1.7 | 1.7 | 1.7 |
| EBIT | 3,531.7 | 3,109.4 | 4,814.9 | 3,234.9 | 8,837.9 | 9,852.4 | 12,601.3 | 16,117.1 | 20,613.9 | 26,365.3 |
| EBIT, % | 70.03 | 60.48 | 65.22 | 31.75 | 67.74 | 59.05 | 59.05 | 59.05 | 59.05 | 59.05 |
| Total Cash | 10,277.2 | 9,212.5 | 3,632.1 | 6,996.2 | 7,045.0 | 12,409.9 | 15,872.3 | 20,300.7 | 25,964.8 | 33,209.1 |
| Total Cash, percent | .0 | .0 | .0 | .0 | .0 | .0 | .0 | .0 | .0 | .0 |
| Account Receivables | 20,871.1 | 29,944.6 | 158.7 | 167.0 | 156.6 | 6,840.9 | 8,749.5 | 11,190.7 | 14,313.0 | 18,306.4 |
| Account Receivables, % | 413.87 | 582.45 | 2.15 | 1.64 | 1.2 | 41 | 41 | 41 | 41 | 41 |
| Inventories | .0 | .0 | .0 | .0 | .0 | .0 | .0 | .0 | .0 | .0 |
| Inventories, % | 0 | 0 | 0 | 0 | 0 | 0 | 0 | 0 | 0 | 0 |
| Accounts Payable | 52.7 | 80.7 | 92.3 | 112.6 | 94.6 | 190.1 | 243.1 | 310.9 | 397.7 | 508.6 |
| Accounts Payable, % | 1.05 | 1.57 | 1.25 | 1.1 | 0.72474 | 1.14 | 1.14 | 1.14 | 1.14 | 1.14 |
| Capital Expenditure | -143.5 | -97.1 | -85.4 | -118.9 | -90.1 | -258.6 | -330.7 | -423.0 | -541.0 | -691.9 |
| Capital Expenditure, % | -2.85 | -1.89 | -1.16 | -1.17 | -0.69063 | -1.55 | -1.55 | -1.55 | -1.55 | -1.55 |
| Tax Rate, % | 24.73 | 24.73 | 24.73 | 24.73 | 24.73 | 24.73 | 24.73 | 24.73 | 24.73 | 24.73 |
| EBITAT | 2,632.1 | 2,314.1 | 3,580.3 | 2,426.1 | 6,652.5 | 7,361.4 | 9,415.2 | 12,042.1 | 15,402.0 | 19,699.2 |
| Depreciation | ||||||||||
| Changes in Account Receivables | ||||||||||
| Changes in Inventories | ||||||||||
| Changes in Accounts Payable | ||||||||||
| Capital Expenditure | ||||||||||
| UFCF | -18,234.4 | -6,710.6 | 33,419.6 | 2,453.4 | 6,722.8 | 798.0 | 7,592.2 | 9,710.4 | 12,419.7 | 15,884.9 |
| WACC, % | 5.22 | 5.22 | 5.22 | 5.22 | 5.23 | 5.22 | 5.22 | 5.22 | 5.22 | 5.22 |
| PV UFCF | ||||||||||
| SUM PV UFCF | 38,401.7 | |||||||||
| Long Term Growth Rate, % | 2.00 | |||||||||
| Free cash flow (T + 1) | 16,203 | |||||||||
| Terminal Value | 503,277 | |||||||||
| Present Terminal Value | 390,236 | |||||||||
| Enterprise Value | 428,638 | |||||||||
| Net Debt | 49,989 | |||||||||
| Equity Value | 378,649 | |||||||||
| Diluted Shares Outstanding, MM | 1,096 | |||||||||
| Equity Value Per Share | 345.42 |
Benefits of Choosing SBFC Finance Limited (SBFCNS)
- Authentic Financial Data: Preloaded financial metrics – including revenue and EBIT – derived from actual and projected statistics.
- Comprehensive Customization: Modify essential parameters (yellow cells) such as WACC, growth percentage, and taxation rates.
- Immediate Valuation Adjustments: Automatic recalculations to evaluate the effects of modifications on SBFC’s fair value.
- Dynamic Excel Template: Designed for quick modifications, scenario analysis, and in-depth forecasts.
- Time-Efficient and Precise: Avoid starting models from the ground up while ensuring accuracy and adaptability.
Key Features
- Customizable Financial Inputs: Adjust essential parameters such as revenue growth, EBITDA %, and capital costs as per your needs.
- Instant DCF Valuation: Quickly computes intrinsic value, NPV, and other financial metrics at your convenience.
- Precision You Can Trust: Leverages SBFC Finance Limited’s (SBFCNS) real-world financial data for accurate valuation results.
- Seamless Scenario Testing: Effortlessly explore various assumptions and evaluate different outcomes.
- Efficiency Booster: Streamlines your process, removing the hassle of constructing complex valuation models from the ground up.
How It Works
- Download the Template: Gain immediate access to the Excel-based SBFC DCF Calculator.
- Input Your Assumptions: Modify the yellow-highlighted cells for growth rates, WACC, margins, and more.
- Instant Calculations: The model automatically recalculates SBFC Finance Limited's intrinsic value.
- Test Scenarios: Experiment with different assumptions to assess potential valuation variations.
- Analyze and Decide: Utilize the outcomes to inform your investment or financial strategy.
Why Opt for SBFC Finance Limited's Calculator?
- Time-Saving: Skip the hassle of building a DCF model from scratch – it’s fully operational.
- Enhanced Accuracy: Dependable financial data and formulas minimize valuation errors.
- Completely Customizable: Adjust the model to align with your unique assumptions and forecasts.
- Simple to Understand: Intuitive charts and outputs facilitate easy analysis of the results.
- Endorsed by Industry Experts: Created for professionals who prioritize accuracy and ease of use.
Who Can Benefit from This Product?
- Professional Investors: Create thorough and dependable valuation models for analyzing investment portfolios.
- Corporate Finance Teams: Evaluate valuation scenarios to inform and shape internal strategies.
- Consultants and Advisors: Deliver precise valuation insights for clients concerning SBFC Finance Limited (SBFCNS).
- Students and Educators: Utilize real-world data to enhance financial modeling skills in teaching and learning environments.
- Finance Enthusiasts: Gain insights into how financial institutions like SBFC Finance Limited (SBFCNS) are assessed in the marketplace.
Contents of the Template
- Comprehensive DCF Model: User-friendly template featuring extensive valuation computations.
- Real-World Data: SBFC Finance Limited’s (SBFCNS) historical and projected financial information preloaded for analysis.
- Customizable Parameters: Modify WACC, growth rates, and tax assumptions to evaluate different scenarios.
- Financial Statements: Complete annual and quarterly breakdowns for enhanced insights.
- Key Ratios: Integrated analysis for assessing profitability, efficiency, and leverage.
- Dashboard with Visual Outputs: Graphs and tables to present clear, actionable results.
Disclaimer
All information, articles, and product details provided on this website are for general informational and educational purposes only. We do not claim any ownership over, nor do we intend to infringe upon, any trademarks, copyrights, logos, brand names, or other intellectual property mentioned or depicted on this site. Such intellectual property remains the property of its respective owners, and any references here are made solely for identification or informational purposes, without implying any affiliation, endorsement, or partnership.
We make no representations or warranties, express or implied, regarding the accuracy, completeness, or suitability of any content or products presented. Nothing on this website should be construed as legal, tax, investment, financial, medical, or other professional advice. In addition, no part of this site—including articles or product references—constitutes a solicitation, recommendation, endorsement, advertisement, or offer to buy or sell any securities, franchises, or other financial instruments, particularly in jurisdictions where such activity would be unlawful.
All content is of a general nature and may not address the specific circumstances of any individual or entity. It is not a substitute for professional advice or services. Any actions you take based on the information provided here are strictly at your own risk. You accept full responsibility for any decisions or outcomes arising from your use of this website and agree to release us from any liability in connection with your use of, or reliance upon, the content or products found herein.